Below is a sample of 25 exam scores. 80 79 69 71 74 73 77 75...
Below is a sample of 25 exam scores.
80 79 69 71 74 73 77 75 65 52 81 84 84 79 70 78 62 77 68 77 88 70 75 85 84
1. Is the exam score significantly greater than 70 at the 5 percent level of significance? Follow and show the 7 steps for hypothesis testing.
2. Determine the p-value and interpret its meaning.
3. What assumption must you make about the population distribution in order to conduct the test in part a? Is the assumption valid? Use and include an appropriate graph from Minitab. Write a couple of sentences supporting your answer.
4. Verify your results (in parts a and b) using Minitab.
Homework Answers
Solution:-
1)
State the hypotheses. The first step is to state the null hypothesis and an alternative hypothesis.
Null hypothesis: u < 70
Alternative hypothesis: u > 70
Note that these hypotheses constitute a one-tailed test.
Formulate an analysis plan. For this analysis, the significance level is 0.05. The test method is a one-sample t-test.
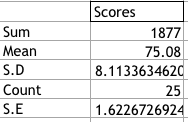
Analyze sample data. Using sample data, we compute the standard error (SE), degrees of freedom (DF), and the t statistic test statistic (t).
SE = s / sqrt(n)
S.E = 1.6227
DF = n - 1
D.F = 24
t = (x - u) / SE
t = 3.13
tcritical = 1.711
Rejection region is t > 1.711.
where s is the standard deviation of the sample, x is the sample mean, u is the hypothesized population mean, and n is the sample size.
The observed sample mean produced a t statistic test statistic of 3.13.
Interpret results. Since the t-value (3.13) lies in the rejection region, hence we have to reject the null hypothesis.
From the above test we have sufficient evidence in the favor of the claim that exam score significantly greater than 70.
2)
Thus the P-value in this analysis is 0.002.
Interpret results. Since the P-value (0.002) is less than the significance level (0.05), we have to reject the null hypothesis.
3) The assumption we must make about the population distribution in order to conduct the test in part a are:-
The population from which sample is taken is assumed to be normally distributed.
The sample is random sample.
Sample size is large enough.
Yes, the assumption is valid.
Gender HeartRate male 70 male 71 male 74 male 80 male 73 male 75 male 82...
 Gender HeartRate
male 70
male 71
male 74
male 80
male 73
male 75
male 82
male 64
male 69
male 70
male 68
male 72
male 78
male 70
male 75
male 74
male 69
male 73
male 77
male 58
male 73
male 65
male 74
male 76
male 72
male 78
male 71
male 74
male 67
male 64
male 78
male 73
male 67
male 66
male 64
male 71
male 72
male 86
male 72...
Gender HeartRate
male 70
male 71
male 74
male 80
male 73
male 75
male 82
male 64
male 69
male 70
male 68
male 72
male 78
male 70
male 75
male 74
male 69
male 73
male 77
male 58
male 73
male 65
male 74
male 76
male 72
male 78
male 71
male 74
male 67
male 64
male 78
male 73
male 67
male 66
male 64
male 71
male 72
male 86
male 72...
Consider the below matrixA, which you can copy and paste directly into Matlab.
Problem #1: Consider the below matrix A, which you can copy and paste directly into Matlab. The matrix contains 3 columns. The first column consists of Test #1 marks, the second column is Test # 2 marks, and the third column is final exam marks for a large linear algebra course. Each row represents a particular student.A = [36 45 75 81 59 73 77 73 73 65 72 78 65 55 83 73 57 78 84 31 60 83...
Use this set of 40 exam scores as the POPULATION for this activity: (put them into...
Use this set of 40 exam scores as the POPULATION for this activity: (put them into List 1 in your calculator) 67 90 74 66 76 79 77 53 86 86 68 81 72 57 79 78 50 66 77 66 81 79 80 73 71 56 81 86 62 69 81 78 77 80 88 62 67 62 74 94 Use this set of 40 exam scores as the POPULATION for this activity: (put them into List 1 in...
Use the Grouped Distribution method for the following exercise (see Self-Test 2-4 for detailed instructions), rounding...
Use the Grouped Distribution method for the following exercise (see Self-Test 2-4 for detailed instructions), rounding each answer to the nearest whole number. Using the frequency distribution below (scores on a statistics exam taken by 80 students), determine:ion 1 of the preliminary test (scores on a statistics exam taken by 80 students), determine: 68 84 75 82 68 90 62 88 76 93 73 79 88 73 60 93 71 59 85 75 61 65 75 87 74 62 95...
Use the accompanying data set on the pulse rates (in beats per minute) of males to...
Use the accompanying data set on the pulse rates (in beats per minute) of males to complete parts (a) and (b) below. LOADING... Click the icon to view the pulse rates of males. a. Find the mean and standard deviation, and verify that the pulse rates have a distribution that is roughly normal. The mean of the pulse rates is 71.871.8 beats per minute. (Round to one decimal place as needed.) The standard deviation of the pulse rates is 12.212.2...
Company 2007 2008 A 73 77 B 75 72 C 77 76 D 80 84 E...
Company 2007 2008 A 73 77 B 75 72 C 77 76 D 80 84 E 90 88 F 64 69 G 70 75 H 77 79 I 74 82 J 81 85 K 77 72 L 69 76 M 80 86 N 74 77 O 76 73 P 78 79 R 77 76 S 76 78 Will improving customer service result in higher stock prices for the companies providing the better service? “When a company’s satisfaction score has improved...
For the given observations: 70 70 71 72 72 73 73 74 76 77 78 78...
For the given observations: 70 70 71 72 72 73 73 74 76 77 78 78 78 79 79. Find the inner quartile range
Student stress at final exam time comes partly from the uncertainty of grades and the consequence...
 Student stress at final exam time comes partly from the
uncertainty of grades and the consequences of those grades. Can
knowledge of a midterm grade be used to predict a final exam grade?
A random sample of 200 BCOM students from recent years was taken
and their percentage grades on assignments, midterm exam, and final
exam were recorded. Let’s examine the ability of midterm and
assignment grades to predict final exam grades.
The data are shown here:
Assignment
Midterm
FinalExam...
Student stress at final exam time comes partly from the
uncertainty of grades and the consequences of those grades. Can
knowledge of a midterm grade be used to predict a final exam grade?
A random sample of 200 BCOM students from recent years was taken
and their percentage grades on assignments, midterm exam, and final
exam were recorded. Let’s examine the ability of midterm and
assignment grades to predict final exam grades.
The data are shown here:
Assignment
Midterm
FinalExam...
2.) Below is a data set for a set of scores on a final exam: 63,...
 2.) Below is a data set for a set of scores on a final exam: 63, 88, 79, 92, 86, 87, 83, 78, 41, 67, 68, 76, 46, 81, 92,77, 84, 76, 70, 66. 77, 75, 98, 81, 82,81, 87, 78, 80, 60, 94, 79, 52, 82, 77, 61, 77, 70, 74, 61 Complete the following questions: (4 points total) (1 point each) a.) Create a frequency distribution by hand b.) Create a histogram by hand c.) Create a stem-and-leaf...
 Gender HeartRate
male 70
male 71
male 74
male 80
male 73
male 75
male 82
male 64
male 69
male 70
male 68
male 72
male 78
male 70
male 75
male 74
male 69
male 73
male 77
male 58
male 73
male 65
male 74
male 76
male 72
male 78
male 71
male 74
male 67
male 64
male 78
male 73
male 67
male 66
male 64
male 71
male 72
male 86
male 72...
Gender HeartRate
male 70
male 71
male 74
male 80
male 73
male 75
male 82
male 64
male 69
male 70
male 68
male 72
male 78
male 70
male 75
male 74
male 69
male 73
male 77
male 58
male 73
male 65
male 74
male 76
male 72
male 78
male 71
male 74
male 67
male 64
male 78
male 73
male 67
male 66
male 64
male 71
male 72
male 86
male 72...
 Student stress at final exam time comes partly from the
uncertainty of grades and the consequences of those grades. Can
knowledge of a midterm grade be used to predict a final exam grade?
A random sample of 200 BCOM students from recent years was taken
and their percentage grades on assignments, midterm exam, and final
exam were recorded. Let’s examine the ability of midterm and
assignment grades to predict final exam grades.
The data are shown here:
Assignment
Midterm
FinalExam...
Student stress at final exam time comes partly from the
uncertainty of grades and the consequences of those grades. Can
knowledge of a midterm grade be used to predict a final exam grade?
A random sample of 200 BCOM students from recent years was taken
and their percentage grades on assignments, midterm exam, and final
exam were recorded. Let’s examine the ability of midterm and
assignment grades to predict final exam grades.
The data are shown here:
Assignment
Midterm
FinalExam...
 2.) Below is a data set for a set of scores on a final exam: 63, 88, 79, 92, 86, 87, 83, 78, 41, 67, 68, 76, 46, 81, 92,77, 84, 76, 70, 66. 77, 75, 98, 81, 82,81, 87, 78, 80, 60, 94, 79, 52, 82, 77, 61, 77, 70, 74, 61 Complete the following questions: (4 points total) (1 point each) a.) Create a frequency distribution by hand b.) Create a histogram by hand c.) Create a stem-and-leaf...
Most questions answered within 3 hours.
-
In Java write a program that asks user’s name, records it in
memory, prints the number...
asked 11 seconds ago -
1) in order to create a virtual image with a concave mirror,
where must an object...
asked 5 minutes ago -
Making “marginal” decisions involves a. calculating the total
benefits of an activity and determining if you...
asked 9 minutes ago -
What volume in milliliters of 9.950×10⁻² M sodium
hydroxide solution is required to reach the equivalence...
asked 11 minutes ago -
GDP 1000 Government Expenditure 120 Investment Expenditure 160
Consumption Expenditure 700 Imports 80 1) Use the...
asked 18 minutes ago -
A new operating system is installed in every workstation at a
large company. The claim of...
asked 23 minutes ago -
1. Draw a sketch of a population of scores that has a normal
distribution. Indicate where...
asked 1 hour ago -
1. Choose the correct answer.
Which continuous random variable is equivalent to a binomial
discrete random...
asked 1 hour ago -
Question text
P1. A random sample was taken from 100 individuals to whom the
blood glucose...
asked 40 minutes ago -
Describe possible gaps you observe within Situational Leadership
Theory. What strategies or adjustments in your own...
asked 40 minutes ago -
Exercise 5.1.2 except the function
below replaces the one on the website:
x &nbs
asked 59 minutes ago -
Required information
[The following information applies to the questions
displayed below.]
Tarnish Industries produces miniature models...
asked 53 minutes ago