The grade point averages (GPA) of 18 randomly selected college students are used to estimate the...
The grade point averages (GPA) of 18 randomly selected college students are used to estimate the mean GPA of the college students. The GPAs from the sample are as follows:
2.3 3.3 2.6 1.8 0.2 3.1 4.0 0.7 3.1
2.3 2.0 3.1 3.4 1.3 2.6 2.6 3.7 2.2
- (5 points) Is it justified to use of the standard normal distribution to construct the confidence interval? Explain.
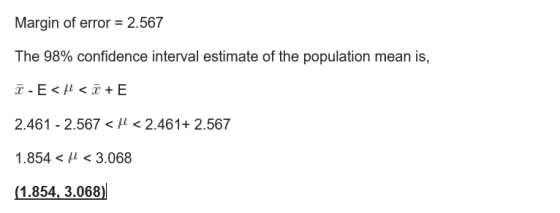
- (10 points) If the population is assumed to be normally distributed, construct a 98% confidence interval for the population mean GPA. Show your work in detail and use 3 decimal digits.
Homework Answers
I have answered the question below
Please up vote for the same and thanks!!!
Do reach out in the comments for any queries
Answer:
| x | x2 |
| 2.3 | 5.29 |
| 3.3 | 10.89 |
| 2.6 | 6.76 |
| 1.8 | 3.24 |
| 0.2 | 0.04 |
| 3.1 | 9.61 |
| 4 | 16 |
| 0.7 | 0.49 |
| 3.1 | 9.61 |
| 2.3 | 5.29 |
| 2 | 4 |
| 3.1 | 9.61 |
| 3.4 | 11.56 |
| 1.3 | 1.69 |
| 2.6 | 6.76 |
| 2.6 | 6.76 |
| 3.7 | 13.69 |
| 2.2 | 4.84 |
| ∑x=44.3 | ∑x2=126.13 |

Add Answer to:
The grade point averages (GPA) of 18 randomly selected college
students are used to estimate the...
The grade point averages (GPA) for 15 randomly selected college students are: 2.3 3.3 2.6  
The grade point averages (GPA) for 15 randomly selected college students are: 2.3 3.3 2.6 1.8 0.2 3.1 0.7 4.0 2.3 2.0 3.1 3.4 13 26 26 Which of the following is the correct confidence interval procedure for a 95% confidence level?
The grade point averages (GPA) for 12 randomly selected college students are shown on the right....
 The grade point averages (GPA) for 12 randomly selected college
students are shown on the right. Complete parts (a) through (c)
below. Assume the population is normally distributed.
2.1, 3.1, 2.6, 1.5, 0.6, 4.0, 2.1, 1.1, 3.6, 0.5, 2.1, 3.4
construct a 90% confidence interval for the population mean
The grade point averages (GPA) for 12 randomly selected college students are shown on the right. Complete parts (a) through (c) 2.1 below. 1.5 Assume the population is normally distributed. 2.1...
The grade point averages (GPA) for 12 randomly selected college
students are shown on the right. Complete parts (a) through (c)
below. Assume the population is normally distributed.
2.1, 3.1, 2.6, 1.5, 0.6, 4.0, 2.1, 1.1, 3.6, 0.5, 2.1, 3.4
construct a 90% confidence interval for the population mean
The grade point averages (GPA) for 12 randomly selected college students are shown on the right. Complete parts (a) through (c) 2.1 below. 1.5 Assume the population is normally distributed. 2.1...
The grade point averages (GPA) for 12 randomly selected college students are shown on the right....
 The grade point averages (GPA) for 12 randomly selected college students are shown on the right. Complete parts (a) through (c) below 2.5 34 2.6 1.9 0.5 4.0 2.2 1.2 3.8 0.2 2.3 3.1 Assume the population is normally distributed. (a) Find the sample mean. x(Round to two decimal places as needed) (b) Find the sample standard deviation. s(Round to two decimal places as needed.) (c) Construct a 95% confidence interval for the population mean A 95% confidence interval for...
The grade point averages (GPA) for 12 randomly selected college students are shown on the right....
The grade point averages (GPA) for 12 randomly selected college students are shown on the right. Complete parts (a) through (c) below. Assume the population is normally distributed. 2.2 3.2 2.5 1.6 0.6 4.0 2.3 1.3 3.6 0.3 2.3 3.4 a) Find the sample mean. x overbar x equals= (Round to two decimal places as needed.) (b) Find the sample standard deviation. s equals= (Round to two decimal places as needed.) (c) Construct a 95% confidence interval for the population...
6. The grade point averages (GPA) for 15 randomly selected college students are: 3.3 2.6 1.8...
 6. The grade point averages (GPA) for 15 randomly selected college students are: 3.3 2.6 1.8 0.2 3.1 0.7 2.3 4.0 2.3 2.0 3.1 3.4 13 26 26 Which of the following is the correct confidence interval procedure for a 95% confidence level? A. SRS Normal told so o known * = 6.25 o=8.52 n= 15 95% CI Zinterval At the 95% confidence level, u is in (1.94, 10.565) B. SRS Normal by QQ graph * = 6.25 s=8.52 n=...
Wo e parts (a) The grade point averages (GPA) for 12 randomly selected college students are...
 Wo e parts (a) The grade point averages (GPA) for 12 randomly selected college students are shown on the right Complet 0 0 1.6 0.8 40 2.1 1.1 3.5 0.4 2.4 3.3 through (c) below Assume the population is normally distributed (a) Find the sample mearn xRound to two decimal places as needed) (b) Find the sample standard deviation sRound to two decimal places as needed.) (c) Construct a 95% confidence interval for the population mean A 95% confidence interval...
The grade point averages (GPA) for 1212 randomly selected college students are shown on the right....
The grade point averages (GPA) for 1212 randomly selected college students are shown on the right. Complete parts (a) through (c) below. Assume the population is normally distributed. 2.52.5 3.33.3 2.92.9 1.91.9 0.80.8 4.04.0 2.42.4 1.41.4 3.73.7 0.40.4 2.12.1 3.43.4 (a) Find the sample mean. x overbarxequals=nothing (Round to two decimal places as needed.) (b) Find the sample standard deviation. sequals=nothing (Round to two decimal places as needed.)(c) Construct a 9999% confidence interval for the population mean muμ. A 9999%...
The grade point averages for 10 randomly selected high school students are listed below. Assume the...
The grade point averages for 10 randomly selected high school students are listed below. Assume the grade point averages are normally distributed. 2.0, 3.2, 1.8, 2.9, 0.9, 4.0, 3.3, 2.9, 3.6, 0.8 Find a 98% confidence interval for the true mean.
The following data are the monthly salaries y and the grade point averages x for students...
 The following data are the monthly salaries y and the grade point averages x for students who obtained a bachelor's degree in business administration. GPA 2.6 3.4 3.7 3.1 3.5 2.9 Monthly Salary (S) 3,600 3,800 4,200 3,700 4,100 2,500 The estimated regression equation for these data is y- 564.3 +964.3x and MSE-268,482. a. Develop a point estimate of the starting salary for a student with a GPA of 3.0 (to 1 decimal). b. Develop a 95% confidence interval for...
The following data are the monthly salaries y and the grade point averages x for students...
 The following data are the monthly salaries y and the grade point averages x for students who obtained a bachelor's degree in business administration. GPA 2.6 3.4 3.6 3.1 3.4 3.1 Monthly Salary ($) 3,500 3,800 4,200 3,800 4,100 2,500 The estimated regression equation for these data is y 914.5 854.8x and MSE 360,484. a. Develop a point estimate of the starting salary for a student with a GPA of 3.0 (to 1 decimal). b. Develop a 95% confidence interval...
 The grade point averages (GPA) for 12 randomly selected college
students are shown on the right. Complete parts (a) through (c)
below. Assume the population is normally distributed.
2.1, 3.1, 2.6, 1.5, 0.6, 4.0, 2.1, 1.1, 3.6, 0.5, 2.1, 3.4
construct a 90% confidence interval for the population mean
The grade point averages (GPA) for 12 randomly selected college students are shown on the right. Complete parts (a) through (c) 2.1 below. 1.5 Assume the population is normally distributed. 2.1...
The grade point averages (GPA) for 12 randomly selected college
students are shown on the right. Complete parts (a) through (c)
below. Assume the population is normally distributed.
2.1, 3.1, 2.6, 1.5, 0.6, 4.0, 2.1, 1.1, 3.6, 0.5, 2.1, 3.4
construct a 90% confidence interval for the population mean
The grade point averages (GPA) for 12 randomly selected college students are shown on the right. Complete parts (a) through (c) 2.1 below. 1.5 Assume the population is normally distributed. 2.1...
 The grade point averages (GPA) for 12 randomly selected college students are shown on the right. Complete parts (a) through (c) below 2.5 34 2.6 1.9 0.5 4.0 2.2 1.2 3.8 0.2 2.3 3.1 Assume the population is normally distributed. (a) Find the sample mean. x(Round to two decimal places as needed) (b) Find the sample standard deviation. s(Round to two decimal places as needed.) (c) Construct a 95% confidence interval for the population mean A 95% confidence interval for...
 6. The grade point averages (GPA) for 15 randomly selected college students are: 3.3 2.6 1.8 0.2 3.1 0.7 2.3 4.0 2.3 2.0 3.1 3.4 13 26 26 Which of the following is the correct confidence interval procedure for a 95% confidence level? A. SRS Normal told so o known * = 6.25 o=8.52 n= 15 95% CI Zinterval At the 95% confidence level, u is in (1.94, 10.565) B. SRS Normal by QQ graph * = 6.25 s=8.52 n=...
 Wo e parts (a) The grade point averages (GPA) for 12 randomly selected college students are shown on the right Complet 0 0 1.6 0.8 40 2.1 1.1 3.5 0.4 2.4 3.3 through (c) below Assume the population is normally distributed (a) Find the sample mearn xRound to two decimal places as needed) (b) Find the sample standard deviation sRound to two decimal places as needed.) (c) Construct a 95% confidence interval for the population mean A 95% confidence interval...
 The following data are the monthly salaries y and the grade point averages x for students who obtained a bachelor's degree in business administration. GPA 2.6 3.4 3.7 3.1 3.5 2.9 Monthly Salary (S) 3,600 3,800 4,200 3,700 4,100 2,500 The estimated regression equation for these data is y- 564.3 +964.3x and MSE-268,482. a. Develop a point estimate of the starting salary for a student with a GPA of 3.0 (to 1 decimal). b. Develop a 95% confidence interval for...
 The following data are the monthly salaries y and the grade point averages x for students who obtained a bachelor's degree in business administration. GPA 2.6 3.4 3.6 3.1 3.4 3.1 Monthly Salary ($) 3,500 3,800 4,200 3,800 4,100 2,500 The estimated regression equation for these data is y 914.5 854.8x and MSE 360,484. a. Develop a point estimate of the starting salary for a student with a GPA of 3.0 (to 1 decimal). b. Develop a 95% confidence interval...
Most questions answered within 3 hours.
-
2. A television network executive has a list of 7 sitcoms and 5
reality shows to...
asked 8 minutes ago -
LawVIEW Question:
As you saw in your second-order system experiments, your systems
oscillate to a change...
asked 1 hour ago -
consider the titration of 50mL of 1.5 M HCOOH with .50 M NaOH.
Ka= 1.8x10^-4 &...
asked 1 hour ago -
"provide products and mechanisms for (z)-3,4-dimethyl-2-pentene
reaction with Br2 in H2o including stereochemisty"
asked 3 hours ago -
FOR the regular expression r= (a+b)*abb
(1) Find the NFA without ε-moves for r.
(2) Convert...
asked 3 hours ago -
what are the moles of, 1.87 g SiO2, 0.95 g NH4Cl, and 2.46g
NaCl?
asked 3 hours ago -
Transaction costs, as they relate to dividend policy,
A)
include the costs of brokerage fees.
B)...
asked 4 hours ago -
Which of the following is a true statement about
inpatriates?
A. Inpatriates are foreign employees who...
asked 4 hours ago -
I've written this program in C++ to compare 2 pizzas using
classes and it works fine....
asked 4 hours ago -
Assume the following information:
Work-in process, beginning 100 units, 25% complete
Units completed and transferred out...
asked 4 hours ago -
what was responsible for factory reforms and improved safety
working conditions? The triangle fire, the jungle,...
asked 4 hours ago -
In 2009, the average starting salary for an individual right out of
college with a bachelor’s...
asked 4 hours ago