
Homework Answers
(a) There are 26 F and 13 Males out of a total of 39 Students
The Mens Quizzes scores are as below
| 1 | M | 55 |
| 2 | M | 86 |
| 3 | M | 58 |
| 4 | M | 70 |
| 5 | M | 83 |
| 6 | M | 80 |
| 7 | M | 49 |
| 8 | M | 55 |
| 9 | M | 67 |
| 10 | M | 74 |
| 11 | M | 81 |
| 12 | M | 78 |
| 13 | M | 84 |
Average = Sum of observations / Total Observations = 920 / 13 = 70.77
The Median. Since n is odd, the median = (n + 1)/ 2 th number = (13 + 1) / 2 = 7th number = 49
For Females
| 1 | F | 61 |
| 2 | F | 59 |
| 3 | F | 54 |
| 4 | F | 62 |
| 5 | F | 49 |
| 6 | F | 73 |
| 7 | F | 66 |
| 8 | F | 66 |
| 9 | F | 73 |
| 10 | F | 75 |
| 11 | F | 69 |
| 12 | F | 66 |
| 13 | F | 87 |
| 14 | F | 74 |
| 15 | F | 78 |
| 16 | F | 91 |
| 17 | F | 67 |
| 18 | F | 66 |
| 19 | F | 89 |
| 20 | F | 77 |
| 21 | F | 63 |
| 22 | F | 87 |
| 23 | F | 82 |
| 24 | F | 81 |
| 25 | F | 81 |
| 26 | F | 92 |
Average = Sum of observations / Total Observations = 1888 / 26 = 72.62
The Median = Middle value
Since n is even, the median = Average of n/2th and the next number = Average of 26/2 = 13th and 14th numbers
= (87 +74) / 2 = 80.5
| Men | Women | |
| Mean | 70.8 | 72.62 |
| Median | 49 | 80.5 |
________________________________________
(a) Test For proportion
The Hypothesis:
p = 0.5
p > 0.5
This is a right tailed test
The Test
Statistic:  = 26 / 39 = 0.667

The p Value: The p value (Right tail) for Z = 2.08, is; p value = 0.0188
The Critical
Value: The critical value (Right tail) at
 = 0.05 (default level) Z critical =
+1.645
= 0.05 (default level) Z critical =
+1.645
The Decision Rule: If Z observed is > Z critical Then Reject H0.
Also If the P value is <
, Then Reject H0
The Decision: Since Z observed (2.08) is > Z critical (1.645), We Reject H0.
Also since P value (0.0188) is <
(0.05), We Reject H0.
The Conclusion: There is sufficient evidence at the 95% significance level to conclude that the majority of students in the class are women
____________________________________________
For Grades the sample statistics are as below
| Men | Women | |
| Total | 937 | 1898 |
| n | 13 | 26 |
| Mean | 72.08 | 73 |
| SD | 8.391 | 8.841 |
Since s1/s2 = 8.391 / 8.841 = 0.949 (it lies between 0.5 and 2) we used the pooled variance.
The degrees of freedom used is n1 + n2 - 2 = 13 + 26 - 2 = 37 (since pooled variance is used)

The Hypothesis:


This is a Two tailed test.
The Test Statistic:We use the students t test as population standard deviations are unknown.
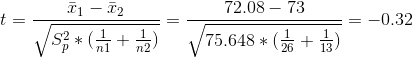
The p Value: The p value (2 Tail) for t = -0.32, df = 37, is; p value = 0.7575
The Critical
Value: The critical value (2 tail) at
= 0.05 (default level), df = 37, t critical = - 2.03 and +
2.03
The Decision Rule: If t observed is > t critical or If t observed is < -t critical, Then Reject H0.
Also If the P value is <
, Then Reject H0
The Decision: Since t lies in between -2.03 and +2.03, We Fail To Reject H0
Also since P value (0.7575) is >
(0.05), We Fail to Reject H0.
The Conclusion: There isn’t sufficient evidence at the 95% significance level to warrant rejection of the claim that Men and Women have the same mean grade.
___________________________________________
Calculation for the mean and standard deviation:
Mean = Sum of observation / Total Observations
Standard deviation = SQRT(Variance)
Variance = Sum Of Squares (SS) / n - 1, where SS = SUM(X - Mean)2.
| Men | |||
| # | X | X - Mean | (X - Mean)2 |
| 1 | 55 | 72.08 | 291.7264 |
| 2 | 72 | 72.08 | 0.0064 |
| 3 | 73 | 72.08 | 0.8464 |
| 4 | 70 | 72.08 | 4.3264 |
| 5 | 64 | 72.08 | 65.2864 |
| 6 | 75 | 72.08 | 8.5264 |
| 7 | 62 | 72.08 | 101.6064 |
| 8 | 68 | 72.08 | 16.6464 |
| 9 | 72 | 72.08 | 0.0064 |
| 10 | 82 | 72.08 | 98.4064 |
| 11 | 82 | 72.08 | 98.4064 |
| 12 | 81 | 72.08 | 79.5664 |
| 13 | 81 | 72.08 | 79.5664 |
| Total | 937 | 844.923 | |
| Women | |||
| # | X | X - Mean | (X - Mean)2 |
| 1 | 59 | 73 | 196 |
| 2 | 63 | 73 | 100 |
| 3 | 65 | 73 | 64 |
| 4 | 66 | 73 | 49 |
| 5 | 61 | 73 | 144 |
| 6 | 59 | 73 | 196 |
| 7 | 59 | 73 | 196 |
| 8 | 67 | 73 | 36 |
| 9 | 70 | 73 | 9 |
| 10 | 74 | 73 | 1 |
| 11 | 72 | 73 | 1 |
| 12 | 72 | 73 | 1 |
| 13 | 79 | 73 | 36 |
| 14 | 75 | 73 | 4 |
| 15 | 73 | 73 | 0 |
| 16 | 88 | 73 | 225 |
| 17 | 76 | 73 | 9 |
| 18 | 73 | 73 | 0 |
| 19 | 78 | 73 | 25 |
| 20 | 83 | 73 | 100 |
| 21 | 73 | 73 | 0 |
| 22 | 85 | 73 | 144 |
| 23 | 80 | 73 | 49 |
| 24 | 81 | 73 | 64 |
| 25 | 77 | 73 | 16 |
| 26 | 90 | 73 | 289 |
| Total | 1898 | 1954 | |
Add Answer to:
The given data is the grades for people in this class. The goal here is to...
Consider the below matrixA, which you can copy and paste directly into Matlab.
Problem #1: Consider the below matrix A, which you can copy and paste directly into Matlab. The matrix contains 3 columns. The first column consists of Test #1 marks, the second column is Test # 2 marks, and the third column is final exam marks for a large linear algebra course. Each row represents a particular student.A = [36 45 75 81 59 73 77 73 73 65 72 78 65 55 83 73 57 78 84 31 60 83...
Use the accompanying data set on the pulse rates (in beats per minute) of males to...
Use the accompanying data set on the pulse rates (in beats per minute) of males to complete parts (a) and (b) below. LOADING... Click the icon to view the pulse rates of males. a. Find the mean and standard deviation, and verify that the pulse rates have a distribution that is roughly normal. The mean of the pulse rates is 71.871.8 beats per minute. (Round to one decimal place as needed.) The standard deviation of the pulse rates is 12.212.2...
The following data represent glucose blood levels (mg/100 ml) after a 12-hour fast for a random...
 The following data represent glucose blood levels (mg/100 ml) after a 12-hour fast for a random sample of 70 women (Reference American Journal of Clinical Nutrition, Vol. 19, pp. 345-351) 45 668) 71 75 64 59 59 75 82 B0 81 85 77 82 90 87 72 70 69 83 71 87 69 81 76 96 83 67 94 101 94 89 94 73 99 93 85 83 90 78 80 85 83 84 74 81 70 65 89 70...
1. Forecast demand for Year 4. a. Explain what technique you utilized to forecast your demand....
 1. Forecast demand for Year 4.
a. Explain what technique you utilized to forecast your
demand.
b. Explain why you chose this technique over others.
Year 3 Year 1 Year 2 Actual Actual Actual Forecast Forecast Forecast Demand Demand Demand Week 1 52 57 63 55 66 77 Week 2 49 58 68 69 75 65 Week 3 47 50 58 65 80 74 Week 4 60 53 58 55 78 67 57 Week 5 49 57 64 76 77...
1. Forecast demand for Year 4.
a. Explain what technique you utilized to forecast your
demand.
b. Explain why you chose this technique over others.
Year 3 Year 1 Year 2 Actual Actual Actual Forecast Forecast Forecast Demand Demand Demand Week 1 52 57 63 55 66 77 Week 2 49 58 68 69 75 65 Week 3 47 50 58 65 80 74 Week 4 60 53 58 55 78 67 57 Week 5 49 57 64 76 77...
Student stress at final exam time comes partly from the uncertainty of grades and the consequence...
 Student stress at final exam time comes partly from the
uncertainty of grades and the consequences of those grades. Can
knowledge of a midterm grade be used to predict a final exam grade?
A random sample of 200 BCOM students from recent years was taken
and their percentage grades on assignments, midterm exam, and final
exam were recorded. Let’s examine the ability of midterm and
assignment grades to predict final exam grades.
The data are shown here:
Assignment
Midterm
FinalExam...
Student stress at final exam time comes partly from the
uncertainty of grades and the consequences of those grades. Can
knowledge of a midterm grade be used to predict a final exam grade?
A random sample of 200 BCOM students from recent years was taken
and their percentage grades on assignments, midterm exam, and final
exam were recorded. Let’s examine the ability of midterm and
assignment grades to predict final exam grades.
The data are shown here:
Assignment
Midterm
FinalExam...
Please compute your z -don't use a package State your conclusion in plain English - not...
 Please compute your z -don't use a package State your conclusion in plain English - not just rejection 1 Students in the online class are suspicious that their schools 60 point loss may have caused their teacher to take out his frustration on the students by giving them a harder than usual exam. They manage to hack into his computer and get the following data: Scores for test Nov 2011 71 74 64 77 58 72 73 79 50 78...
5. Mark’s class just took the admission test for business school and averaged 87.05. Chapter 10...
5. Mark’s class just took the admission test for business school and averaged 87.05. Chapter 10 Data Set 2 contains the population of scores for the 10 other classes in Mark’s university. How did Mark’s class do? Class 1 Class 2 Class 3 Class 4 Class 5 Class 6 Class 7 Class 8 Class 9 Class 10 78 81 96 85 88 78 90 79 96 86 77 78 97 90 88 82 86 93 87 89 78 93 88...
3.3 Table 3.10 shows the scores in the final examination F and the scores in two preliminary exam...
 3.3 Table 3.10 shows the scores in the final examination F and the scores in two preliminary examinations P1 and P2 for 22 students in a statistics course. The data can be found in the book's Web site. (a) Fit each of the following models to the data: Model 1 F Bo BiP Model 2 F- Model 3 : F-k) + AP,+AP, + ε Table 3.10 Examination Data: Scores in the Final (F), First Preliminary (Pi), and Second Preliminary (P2)...
Use the Grouped Distribution method for the following exercise (see Self-Test 2-4 for detailed instructions), rounding...
Use the Grouped Distribution method for the following exercise (see Self-Test 2-4 for detailed instructions), rounding each answer to the nearest whole number. Using the frequency distribution below (scores on a statistics exam taken by 80 students), determine:ion 1 of the preliminary test (scores on a statistics exam taken by 80 students), determine: 68 84 75 82 68 90 62 88 76 93 73 79 88 73 60 93 71 59 85 75 61 65 75 87 74 62 95...
 The following data represent glucose blood levels (mg/100 ml) after a 12-hour fast for a random sample of 70 women (Reference American Journal of Clinical Nutrition, Vol. 19, pp. 345-351) 45 668) 71 75 64 59 59 75 82 B0 81 85 77 82 90 87 72 70 69 83 71 87 69 81 76 96 83 67 94 101 94 89 94 73 99 93 85 83 90 78 80 85 83 84 74 81 70 65 89 70...
 1. Forecast demand for Year 4.
a. Explain what technique you utilized to forecast your
demand.
b. Explain why you chose this technique over others.
Year 3 Year 1 Year 2 Actual Actual Actual Forecast Forecast Forecast Demand Demand Demand Week 1 52 57 63 55 66 77 Week 2 49 58 68 69 75 65 Week 3 47 50 58 65 80 74 Week 4 60 53 58 55 78 67 57 Week 5 49 57 64 76 77...
1. Forecast demand for Year 4.
a. Explain what technique you utilized to forecast your
demand.
b. Explain why you chose this technique over others.
Year 3 Year 1 Year 2 Actual Actual Actual Forecast Forecast Forecast Demand Demand Demand Week 1 52 57 63 55 66 77 Week 2 49 58 68 69 75 65 Week 3 47 50 58 65 80 74 Week 4 60 53 58 55 78 67 57 Week 5 49 57 64 76 77...
 Student stress at final exam time comes partly from the
uncertainty of grades and the consequences of those grades. Can
knowledge of a midterm grade be used to predict a final exam grade?
A random sample of 200 BCOM students from recent years was taken
and their percentage grades on assignments, midterm exam, and final
exam were recorded. Let’s examine the ability of midterm and
assignment grades to predict final exam grades.
The data are shown here:
Assignment
Midterm
FinalExam...
Student stress at final exam time comes partly from the
uncertainty of grades and the consequences of those grades. Can
knowledge of a midterm grade be used to predict a final exam grade?
A random sample of 200 BCOM students from recent years was taken
and their percentage grades on assignments, midterm exam, and final
exam were recorded. Let’s examine the ability of midterm and
assignment grades to predict final exam grades.
The data are shown here:
Assignment
Midterm
FinalExam...
 Please compute your z -don't use a package State your conclusion in plain English - not just rejection 1 Students in the online class are suspicious that their schools 60 point loss may have caused their teacher to take out his frustration on the students by giving them a harder than usual exam. They manage to hack into his computer and get the following data: Scores for test Nov 2011 71 74 64 77 58 72 73 79 50 78...
 3.3 Table 3.10 shows the scores in the final examination F and the scores in two preliminary examinations P1 and P2 for 22 students in a statistics course. The data can be found in the book's Web site. (a) Fit each of the following models to the data: Model 1 F Bo BiP Model 2 F- Model 3 : F-k) + AP,+AP, + ε Table 3.10 Examination Data: Scores in the Final (F), First Preliminary (Pi), and Second Preliminary (P2)...
Most questions answered within 3 hours.
-
A child's mother has type A blood. Their father has type B
blood. The child has...
asked 54 minutes ago -
Last year's dividend (D0) was$3.20per share. The constant growth
in dividends=6.25%. Required return=12%.
Requirement 1:
What...
asked 33 minutes ago -
What is the chemical equation for the reaction that occurs
between hydrochloric acid & potassium carbonate?...
asked 42 minutes ago -
Today is your 25th birthday, and you want to save $1.9 Million
by your birthday at...
asked 1 hour ago -
James Bakery sells cupcakes to William's Restaurant. The credit
terms are 1%/5/net 15. The selling price...
asked 3 hours ago -
The cost of ink cartridges for inkjet printers can be
substantial over the life of a...
asked 3 hours ago -
what do you think would be your reservations in
relaying on the linear regression model for...
asked 3 hours ago -
Which of the following best describes the expected value of a
discrete random variable?
Select one:...
asked 3 hours ago -
An infinite slab of ordinary water 16 cm thick contains a planar
source at its center...
asked 3 hours ago -
Generate the balanced redox reaction for the oxidation of HS- to
SO4-2 using the reduction of...
asked 4 hours ago -
The marginal utility of beer is 5. The marginal utility of pizza
is 6.
We should...
asked 4 hours ago -
2. A fair red die and a fair blue die are rolled 2 times each.
What...
asked 4 hours ago