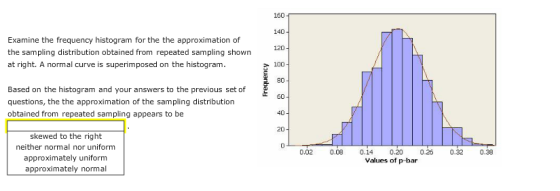
160 140 Examine the frequency histogram for the the approximation of the sampling distribution obtained from repeated sampling shown at right. A normal curve is superimposed on the histogram. 120 100 80 60 40 20 Based on the histogram and your answers to the previous set of questions, the the approximation of the sampling distribution obtained from repeated sampling appears to be skewed to the right neither normal nor uniform approximately uniform approximately normal 0.02 0.08 0.14 0.20 0.26 0.32 0.38 Values of p-bar
Homework Answers
Add Answer to:
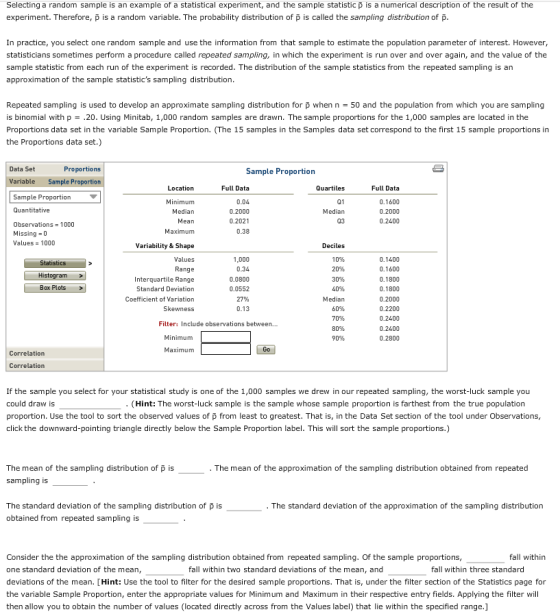
Selecting a random sample is an example of a statistical experiment, and the sample statistic p i...
Data Se Sample Variables 1 Proportions Observations 1000 p-bar for 1,000 samples (n 50] drawn fro...
 Data Se Sample Variables 1 Proportions Observations 1000 p-bar for 1,000 samples (n 50] drawn from a binomial population (p 0.30) Minitab was used to generate the samples. Observations> Observations Variable Type Form Values Missing Sample Proportion Quantitative Numeric 1000 Variable Correlation Correlation If the sample you select for your statistical study is one of the 1,000 samples we drew in our repeated sampling, the worst-luck sample you could draw proportion. Use the tool to sort the observed values of...
6. The sampling distribution of the sample proportion In 2007, about 30% of new-car purchases in ...
 Please Help me to full the all
blank (11 blanks in total)
6. The sampling distribution of the sample proportion In 2007, about 30% of new-car purchases in California were financed with a home equity loan. [Source: "Auto Industry Feels the Pain of Tight Credit," The New York Times, May 27, 2008.] The ongoing process of new-car purchases in California can be viewed as an infinite population Define p as the proportion of the population of new-car purchases in California...
Please Help me to full the all
blank (11 blanks in total)
6. The sampling distribution of the sample proportion In 2007, about 30% of new-car purchases in California were financed with a home equity loan. [Source: "Auto Industry Feels the Pain of Tight Credit," The New York Times, May 27, 2008.] The ongoing process of new-car purchases in California can be viewed as an infinite population Define p as the proportion of the population of new-car purchases in California...
6. The sampling distribution of the sample proportion Aa Aa In 2007, about 14% of new-car purchas...
 6. The sampling distribution of the sample proportion Aa Aa In 2007, about 14% of new-car purchases in New York were financed with a home equity loan. [Source: "Auto Industry Feels the Pain of Tight Credit," The New York Times, May 27, 2008.] The ongoing process of new-car purchases in New York can be viewed as an infinite population Define p as the proportion of the population of new-car purchases in New York that are financed with a home equity...
6. The sampling distribution of the sample proportion Aa Aa In 2007, about 14% of new-car...
 6. The sampling distribution of the sample proportion Aa Aa In 2007, about 14% of new-car purchases in New York were financed with a home equity loan. [Source: "Auto Industry Feels the Pain of Tight Credit," The New York Times, May 27, 2008.] The ongoing process of new-car purchases in New York can be viewed as an infinite population Define p as the proportion of the population of new-car purchases in New York that are financed with a home equity...
, Samples In 30) drawn from a uniform distribution la Minitab was used to generate the...
 , Samples In 30) drawn from a uniform distribution la Minitab was used to generate the samples. es 300, b 500) Variables 15 Observations Variable TypeFormValues Missing Sample 1 Quantitative Sample 2 Quantitative Numeric Sample 3 Quantitative Numeric Sample 4 Quantitative Sample 5 ive Sample 6 Quantitative Sample 7 Quantitative Observations Sample 8 Quantitative Numeric Sample 9 Quantitative Sample 10 Quantitative Sample 11 Quantitative Sample 12 Quantitative Sample 13 Quantitative Sample 14 Quantitative Sample 15 Quantitative Numeric Numeric Variable Numeric...
A. Suppose you take a sample of size n from a population and calculate a statistic...
 A. Suppose you take a sample of size n from a population and calculate a statistic from that sample. The statistic could be a sample proportion p, a sample mean x, or another statistic. Then suppose we repeat this process over and over again until we find all possible samples of size n from the population (this is a theoretical idea) and we calculate the same statistic from 1. each sample. The collection of all of the statistics calculated is...
I need help with these sampling charts Your Turn (Continued) Sampling Distribution (n = 50) Sampling...
 I need help with these sampling charts
Your Turn (Continued) Sampling Distribution (n = 50) Sampling Dotplot of Proportion Len Tail Two-Tall Right Tall Sangles - 120 0.591 std error -0.068 40 30 20 10 0 0.40 0.45 0.50 0.55 0.65 0.70 0.75 0.80 In the simulation, when we are building a sampling distribution, what does each dot represent in the graph? A random sample of 50 college students - The population proportion of female college students at is 60%,...
I need help with these sampling charts
Your Turn (Continued) Sampling Distribution (n = 50) Sampling Dotplot of Proportion Len Tail Two-Tall Right Tall Sangles - 120 0.591 std error -0.068 40 30 20 10 0 0.40 0.45 0.50 0.55 0.65 0.70 0.75 0.80 In the simulation, when we are building a sampling distribution, what does each dot represent in the graph? A random sample of 50 college students - The population proportion of female college students at is 60%,...
Lesson 6.2.4: Binomial Distribution and Sample Proportions A sample proportion, such as the one computed in...
 Lesson 6.2.4: Binomial Distribution and Sample Proportions A sample proportion, such as the one computed in Question 4, is equal to a number of successes (x), divided by the sample size (n). The notation for a sample proportion is p, and it is computed by the formula p = Each value of x corresponds to a unique sample proportion ( p ), as computed by this formula. For example, x = 1 implies p = + - 0.10. These events,...
Structural steel is often treated with a protective coating (called an intumescent coating) that insulates the steel against damage from fire
 1. The sampling distribution of the sample mean Structural steel is often treated with a protective coating (called an intumescent coating) that insulates the steel against damage from fire. Coatings are rated according to the number of hours of high-temperature exposure the treated steel can withstand, but if the coating is not applied with a mean thickness within the range specified by its manufacturer, the protection it provides will last for a shorter time than its rating. An office tower under construction...
Use another random decimal fraction generator at Random.org, linked here, to generate a list of ten...
Use another random decimal fraction generator at Random.org, linked here, to generate a list of ten two-digit random numbers between 10 and 30. Calculate the z-score of the median of the data set. Set 1: 13, 14, 20, 21, 22, 24, 25, 26, 27, 30 What does the z-score of the data set median just above tell you about the shape of the distribution? How do you know this? If you were to take repeated random samples of n =...
 Data Se Sample Variables 1 Proportions Observations 1000 p-bar for 1,000 samples (n 50] drawn from a binomial population (p 0.30) Minitab was used to generate the samples. Observations> Observations Variable Type Form Values Missing Sample Proportion Quantitative Numeric 1000 Variable Correlation Correlation If the sample you select for your statistical study is one of the 1,000 samples we drew in our repeated sampling, the worst-luck sample you could draw proportion. Use the tool to sort the observed values of...
 Please Help me to full the all
blank (11 blanks in total)
6. The sampling distribution of the sample proportion In 2007, about 30% of new-car purchases in California were financed with a home equity loan. [Source: "Auto Industry Feels the Pain of Tight Credit," The New York Times, May 27, 2008.] The ongoing process of new-car purchases in California can be viewed as an infinite population Define p as the proportion of the population of new-car purchases in California...
Please Help me to full the all
blank (11 blanks in total)
6. The sampling distribution of the sample proportion In 2007, about 30% of new-car purchases in California were financed with a home equity loan. [Source: "Auto Industry Feels the Pain of Tight Credit," The New York Times, May 27, 2008.] The ongoing process of new-car purchases in California can be viewed as an infinite population Define p as the proportion of the population of new-car purchases in California...
 6. The sampling distribution of the sample proportion Aa Aa In 2007, about 14% of new-car purchases in New York were financed with a home equity loan. [Source: "Auto Industry Feels the Pain of Tight Credit," The New York Times, May 27, 2008.] The ongoing process of new-car purchases in New York can be viewed as an infinite population Define p as the proportion of the population of new-car purchases in New York that are financed with a home equity...
 6. The sampling distribution of the sample proportion Aa Aa In 2007, about 14% of new-car purchases in New York were financed with a home equity loan. [Source: "Auto Industry Feels the Pain of Tight Credit," The New York Times, May 27, 2008.] The ongoing process of new-car purchases in New York can be viewed as an infinite population Define p as the proportion of the population of new-car purchases in New York that are financed with a home equity...
 , Samples In 30) drawn from a uniform distribution la Minitab was used to generate the samples. es 300, b 500) Variables 15 Observations Variable TypeFormValues Missing Sample 1 Quantitative Sample 2 Quantitative Numeric Sample 3 Quantitative Numeric Sample 4 Quantitative Sample 5 ive Sample 6 Quantitative Sample 7 Quantitative Observations Sample 8 Quantitative Numeric Sample 9 Quantitative Sample 10 Quantitative Sample 11 Quantitative Sample 12 Quantitative Sample 13 Quantitative Sample 14 Quantitative Sample 15 Quantitative Numeric Numeric Variable Numeric...
 A. Suppose you take a sample of size n from a population and calculate a statistic from that sample. The statistic could be a sample proportion p, a sample mean x, or another statistic. Then suppose we repeat this process over and over again until we find all possible samples of size n from the population (this is a theoretical idea) and we calculate the same statistic from 1. each sample. The collection of all of the statistics calculated is...
 I need help with these sampling charts
Your Turn (Continued) Sampling Distribution (n = 50) Sampling Dotplot of Proportion Len Tail Two-Tall Right Tall Sangles - 120 0.591 std error -0.068 40 30 20 10 0 0.40 0.45 0.50 0.55 0.65 0.70 0.75 0.80 In the simulation, when we are building a sampling distribution, what does each dot represent in the graph? A random sample of 50 college students - The population proportion of female college students at is 60%,...
I need help with these sampling charts
Your Turn (Continued) Sampling Distribution (n = 50) Sampling Dotplot of Proportion Len Tail Two-Tall Right Tall Sangles - 120 0.591 std error -0.068 40 30 20 10 0 0.40 0.45 0.50 0.55 0.65 0.70 0.75 0.80 In the simulation, when we are building a sampling distribution, what does each dot represent in the graph? A random sample of 50 college students - The population proportion of female college students at is 60%,...
 Lesson 6.2.4: Binomial Distribution and Sample Proportions A sample proportion, such as the one computed in Question 4, is equal to a number of successes (x), divided by the sample size (n). The notation for a sample proportion is p, and it is computed by the formula p = Each value of x corresponds to a unique sample proportion ( p ), as computed by this formula. For example, x = 1 implies p = + - 0.10. These events,...
Most questions answered within 3 hours.
-
1. (a) When a battery is connected to the plates of a 6.00-µF
capacitor, it stores...
asked 3 hours ago -
A gas reservoir has the following characteristics:
A= 3,000 acres
h= 30 ft
? = 0.15...
asked 3 hours ago -
2. A television network executive has a list of 7 sitcoms and 5
reality shows to...
asked 4 hours ago -
LawVIEW Question:
As you saw in your second-order system experiments, your systems
oscillate to a change...
asked 5 hours ago -
consider the titration of 50mL of 1.5 M HCOOH with .50 M NaOH.
Ka= 1.8x10^-4 &...
asked 5 hours ago -
"provide products and mechanisms for (z)-3,4-dimethyl-2-pentene
reaction with Br2 in H2o including stereochemisty"
asked 7 hours ago -
FOR the regular expression r= (a+b)*abb
(1) Find the NFA without ε-moves for r.
(2) Convert...
asked 7 hours ago -
what are the moles of, 1.87 g SiO2, 0.95 g NH4Cl, and 2.46g
NaCl?
asked 7 hours ago -
Transaction costs, as they relate to dividend policy,
A)
include the costs of brokerage fees.
B)...
asked 8 hours ago -
Which of the following is a true statement about
inpatriates?
A. Inpatriates are foreign employees who...
asked 8 hours ago -
I've written this program in C++ to compare 2 pizzas using
classes and it works fine....
asked 8 hours ago -
Assume the following information:
Work-in process, beginning 100 units, 25% complete
Units completed and transferred out...
asked 8 hours ago