The comparative balance sheets for 2021 and 2020 and the statement of income for 2021 are...
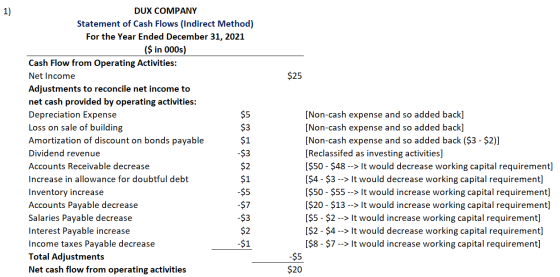
The comparative balance sheets for 2021 and 2020 and the statement of income for 2021 are given below for Dux Company. Additional information from Dux’s accounting records is provided also.
| DUX COMPANY Comparative Balance Sheets December 31, 2021 and 2020 ($ in thousands) |
||||||||
| 2021 | 2020 | |||||||
| Assets | ||||||||
| Cash | $ | 33 | $ | 20 | ||||
| Accounts receivable | 48 | 50 | ||||||
| Less: Allowance for uncollectible accounts | (4 | ) | (3 | ) | ||||
| Dividends receivable | 3 | 2 | ||||||
| Inventory | 55 | 50 | ||||||
| Long-term investment | 15 | 10 | ||||||
| Land | 70 | 40 | ||||||
| Buildings and equipment | 225 | 250 | ||||||
| Less: Accumulated depreciation | (25 | ) | (50 | ) | ||||
| $ | 420 | $ | 369 | |||||
| Liabilities | ||||||||
| Accounts payable | $ | 13 | $ | 20 | ||||
| Salaries payable | 2 | 5 | ||||||
| Interest payable | 4 | 2 | ||||||
| Income tax payable | 7 | 8 | ||||||
| Notes payable | 30 | 0 | ||||||
| Bonds payable | 95 | 70 | ||||||
| Less: Discount on bonds | (2 | ) | (3 | ) | ||||
| Shareholders' Equity | ||||||||
| Common stock | 210 | 200 | ||||||
| Paid-in capital—excess of par | 24 | 20 | ||||||
| Retained earnings | 45 | 47 | ||||||
| Less: Treasury stock | (8 | ) | 0 | |||||
| $ | 420 | $ | 369 | |||||
| DUX COMPANY Income Statement For the Year Ended December 31, 2021 ($ in thousands) |
||||||
| Revenues | ||||||
| Sales revenue | $ | 200 | ||||
| Dividend revenue | 3 | $ | 203 | |||
| Expenses | ||||||
| Cost of goods sold | 120 | |||||
| Salaries expense | 25 | |||||
| Depreciation expense | 5 | |||||
| Bad debt expense | 1 | |||||
| Interest expense | 8 | |||||
| Loss on sale of building | 3 | |||||
| Income tax expense | 16 | 178 | ||||
| Net income | $ | 25 | ||||
Additional information from the accounting records:
- A building that originally cost $40,000, and which was three-fourths depreciated, was sold for $7,000.
- The common stock of Byrd Corporation was purchased for $5,000 as a long-term investment.
- Property was acquired by issuing a 13%, seven-year, $30,000 note payable to the seller.
- New equipment was purchased for $15,000 cash.
- On January 1, 2021, bonds were sold at their $25,000 face value.
- On January 19, Dux issued a 5% stock dividend (1,000 shares). The market price of the $10 par value common stock was $14 per share at that time.
- Cash dividends of $13,000 were paid to shareholders.
- On November 12, 500 shares of common stock were repurchased as treasury stock at a cost of $8,000.
Required:
Prepare the statement of cash flows of Dux Company for the year
ended December 31, 2021. Present cash flows from operating
activities by the direct method. (Do not round your
intermediate calculations. Enter your answers in thousands (i.e.,
10,000 should be entered as 10). Amounts to be deducted should be
indicated with a minus sign.)
Homework Answers


Add Answer to:
The comparative balance sheets for 2021 and 2020 and the
statement of income for 2021 are...
The comparative balance sheets for 2021 and 2020 and the statement of income for 2021 are...
The comparative balance sheets for 2021 and 2020 and the statement of income for 2021 are given below for Dux Company. Additional information from Dux's accounting records is provided also. DUX COMPANY Comparative Balance Sheets December 31, 2021 and 2020 ($ in thousands) 2021 2020 Assets Cash $ 33 $ 20 Accounts receivable 48 50 Less: Allowance for uncollectible accounts (4 ) (3 ) Dividends receivable 3 2 Inventory 55 50 Long-term investment 15 10 Land 70 40 Buildings and...
he comparative balance sheets for 2021 and 2020 and the statement of income for 2021 are...
he comparative balance sheets for 2021 and 2020 and the statement of income for 2021 are given below for Dux Company. Additional information from Dux's accounting records is provided also. DUX COMPANY Comparative Balance Sheets December 31, 2021 and 2020 ($ in thousands) 2021 2020 Assets Cash $ 33 $ 20 Accounts receivable 48 50 Less: Allowance for uncollectible accounts (4 ) (3 ) Dividends receivable 3 2 Inventory 55 50 Long-term investment 15 10 Land 70 40 Buildings and...
The comparative balance sheets for 2021 and 2020 and the statement of income for 2021 are...
 The comparative balance sheets for 2021 and 2020 and the statement of income for 2021 are given below for Dux Company Additional information from Dux's accounting records is provided also. DUX COMPANY Comparative Balance Sheets December 31, 2021 and 2020 ($ in thousands) 2021 2020 $ 49 46 Assets Cash Accounts receivable Less: Allowance for uncollectible accounts Dividends receivable Inventory Long-term investment Land Buildings and equipment Less: Accumulated depreciation $ 24 53 (2) 2 3 65 21 85 273 (70)...
DUX COMPANY Comparative Balance Sheets December 31, 2021 and 2020 ($ in thousands) 2021 2020 Assets...
 DUX COMPANY
Comparative Balance Sheets
December 31, 2021 and 2020
($ in thousands)
2021
2020
Assets
Cash
$
33
$
20
Accounts receivable
48
50
Less: Allowance for uncollectible accounts
(4
)
(3
)
Dividends receivable
3
2
Inventory
55
50
Long-term investment
15
10
Land
70
40
Buildings and equipment
225
250
Less: Accumulated depreciation
(25
)
(50
)
$
420
$
369
Liabilities
Accounts payable
$
13
$
20
Salaries payable
2
5
Interest payable
4
2
Income...
DUX COMPANY
Comparative Balance Sheets
December 31, 2021 and 2020
($ in thousands)
2021
2020
Assets
Cash
$
33
$
20
Accounts receivable
48
50
Less: Allowance for uncollectible accounts
(4
)
(3
)
Dividends receivable
3
2
Inventory
55
50
Long-term investment
15
10
Land
70
40
Buildings and equipment
225
250
Less: Accumulated depreciation
(25
)
(50
)
$
420
$
369
Liabilities
Accounts payable
$
13
$
20
Salaries payable
2
5
Interest payable
4
2
Income...
The comparative balance sheets for 2018 and 2017 and the statement of income for 2018 are...
 The comparative balance sheets for 2018 and 2017 and the statement of income for 2018 are given below for Dux Company Additional information from Dux's accounting records is provided also. DUX COMPANY Comparative Balance Sheets Decenber 31, 2018 and 2017 s in 000s) Assets Cash Accounts receivable 2018 2017 $ 33 20 (4)So eBook 48 Less: Allovance for uncollectible accounts Dividends receivable Inventory Long-term investment Land Buildings and equipment 55 50 10 10 250 225 250 Print (25) (50 $420...
Comparative balance sheets for 2021 and 2020 and a statement of income for 2021 are given...
Comparative balance sheets for 2021 and 2020 and a statement of income for 2021 are given below for Metagrobolize Industries. Additional information from the accounting records of Metagrobolize also is provided. METAGROBOLIZE INDUSTRIES Comparative Balance Sheets December 31, 2021 and 2020 ($ in thousands) 2021 2020 Assets Cash $ 520 $ 225 Accounts receivable 630 330 Inventory 780 420 Land 550 540 Building 700 700 Less: Accumulated depreciation (300 ) (280) Equipment 3,200 2,990 Less: Accumulated depreciation (439 ) (400...
The comparative balance sheets for 2018 and 2017 and the statement of income for 2018 are...
The comparative balance sheets for 2018 and 2017 and the statement of income for 2018 are given below for Dux Company. Additional information from Dux's accounting records is provided also. DUX COMPANY Comparative Balance Sheets December 31, 2018 and 2017 ($ in 000s) 2018 2017 Assets Cash $ 64 $ 25 Accounts receivable 42 55 Less: Allowance for uncollectible accounts (4 ) (3 ) Dividends receivable 4 3 Inventory 75 70 Long-term investment 22 20 Land 85 65 Buildings and...
The comparative balance sheets for 2021 and 2020 and the statement of income for 2021 are...
The comparative balance sheets for 2021 and 2020 and the statement of income for 2021 are given below for National Intercable Company. Additional information from NIC’s accounting records is provided also. NATIONAL INTERCABLE COMPANY Comparative Balance Sheets December 31, 2021 and 2020 ($ in millions) 2021 2020 Assets Cash $ 137 $ 115 Accounts receivable 342 335 Less: Allowance for uncollectible accounts (7 ) (5 ) Prepaid insurance 6 11 Inventory 320 315 Long-term investment 60 95 Land 220 220...
Comparative balance sheets for 2021 and 2020 and a statement of income for 2021 are given...
Comparative balance sheets for 2021 and 2020 and a statement of income for 2021 are given below for Metagrobolize Industries. Additional information from the accounting records of Metagrobolize also is provided. METAGROBOLIZE INDUSTRIES Comparative Balance Sheets December 31, 2021 and 2020 ($ in thousands) 2021 2020 Assets Cash $ 390 $ 190 Accounts receivable 450 240 Inventory 600 375 Land 600 560 Building 900 900 Less: Accumulated depreciation (300 ) (285 ) Equipment 2,750 2,450 Less: Accumulated depreciation (430 )...
Required information The comparative balance sheets for 2018 and 2017 and the statement of income for...
 Required information The comparative balance sheets for 2018 and 2017 and the statement of income for 2018 are given below for Dux Company. Additional information from Dux's accounting records is provided also. DUX COMPANY Comparative Balance Sheets December 31, 2018 and 2017 $ in e08s) 2018 2817 Assets Cash Accounts receivable $.75、$69 Less: Allowance for uncollectible accounts Dividends receivable Inventory Long-term investment 45 31 60 268 40 28 30 380 Buildings and equipment Less: Accumulated depreciation (43) (80) $ 474...
 The comparative balance sheets for 2021 and 2020 and the statement of income for 2021 are given below for Dux Company Additional information from Dux's accounting records is provided also. DUX COMPANY Comparative Balance Sheets December 31, 2021 and 2020 ($ in thousands) 2021 2020 $ 49 46 Assets Cash Accounts receivable Less: Allowance for uncollectible accounts Dividends receivable Inventory Long-term investment Land Buildings and equipment Less: Accumulated depreciation $ 24 53 (2) 2 3 65 21 85 273 (70)...
 DUX COMPANY
Comparative Balance Sheets
December 31, 2021 and 2020
($ in thousands)
2021
2020
Assets
Cash
$
33
$
20
Accounts receivable
48
50
Less: Allowance for uncollectible accounts
(4
)
(3
)
Dividends receivable
3
2
Inventory
55
50
Long-term investment
15
10
Land
70
40
Buildings and equipment
225
250
Less: Accumulated depreciation
(25
)
(50
)
$
420
$
369
Liabilities
Accounts payable
$
13
$
20
Salaries payable
2
5
Interest payable
4
2
Income...
DUX COMPANY
Comparative Balance Sheets
December 31, 2021 and 2020
($ in thousands)
2021
2020
Assets
Cash
$
33
$
20
Accounts receivable
48
50
Less: Allowance for uncollectible accounts
(4
)
(3
)
Dividends receivable
3
2
Inventory
55
50
Long-term investment
15
10
Land
70
40
Buildings and equipment
225
250
Less: Accumulated depreciation
(25
)
(50
)
$
420
$
369
Liabilities
Accounts payable
$
13
$
20
Salaries payable
2
5
Interest payable
4
2
Income...
 The comparative balance sheets for 2018 and 2017 and the statement of income for 2018 are given below for Dux Company Additional information from Dux's accounting records is provided also. DUX COMPANY Comparative Balance Sheets Decenber 31, 2018 and 2017 s in 000s) Assets Cash Accounts receivable 2018 2017 $ 33 20 (4)So eBook 48 Less: Allovance for uncollectible accounts Dividends receivable Inventory Long-term investment Land Buildings and equipment 55 50 10 10 250 225 250 Print (25) (50 $420...
 Required information The comparative balance sheets for 2018 and 2017 and the statement of income for 2018 are given below for Dux Company. Additional information from Dux's accounting records is provided also. DUX COMPANY Comparative Balance Sheets December 31, 2018 and 2017 $ in e08s) 2018 2817 Assets Cash Accounts receivable $.75、$69 Less: Allowance for uncollectible accounts Dividends receivable Inventory Long-term investment 45 31 60 268 40 28 30 380 Buildings and equipment Less: Accumulated depreciation (43) (80) $ 474...
Most questions answered within 3 hours.
-
We
conduct A study to estimate the mean age of the population of women
at the...
asked 5 minutes ago -
.13 : Assume that we make an enhancement to a computer that
improves some mode of...
asked 7 minutes ago -
4)
Find the tension in an elevator cable if the 1000 kg elevator is
descending with...
asked 13 minutes ago -
A random sample of 51 newborn babies was taken at the Hospital.
The sample mean was...
asked 11 minutes ago -
Industry standards suggest that 16% of new vehicles require
warranty service within the first year. Jones...
asked 22 minutes ago -
1) Comment of this statement: “A compiler transforms high-level
language statements directly into object codes”.
asked 25 minutes ago -
Calculate the molality, mole-fraction and percent mass of 28.9M
HF at 25 degrees Celcius of the...
asked 34 minutes ago -
A developmental psychologist believes that children raised in
bilingual families will have higher verbal fluency at...
asked 41 minutes ago -
A fast food meal has 5660 kJ of energy. A person uses energy at
a rate...
asked 53 minutes ago -
The pKb for a generic amine(R-NH2)) in
aqueous solution is 6.30. What is its pKa?
asked 55 minutes ago -
The following reactions have the indicated equilibrium constants
at a particular temperature: N2(g) + O2(g) ⇌...
asked 57 minutes ago -
Please Help ASAP.
1Consider the below code which iterates over a linked
list of n nodes...
asked 1 hour ago