Complete the following table by selecting the term that matches each definition. Definition Quantity Demanded Demand...
Complete the following table by selecting the term that matches each definition.
|
Definition |
Quantity Demanded |
Demand Curve |
Demand Schedule |
Law of Demand |
|
|---|---|---|---|---|---|
| The claim that, ceteris paribus, the quantity demanded of a good falls when the price of that good rises | |||||
| A graphical representation of the relationship between the price of a good and the amount of the good that buyers are willing and able to purchase at various prices | |||||
| A table showing the relationship between the price of a good and the amount that buyers are willing and able to purchase at various prices | |||||
| The amount of a good that buyers are willing and able to purchase at a given price |
Apply your understanding of the previous key terms by completing the following scenario with the appropriate terminology.
Your boss would like your help on a marketing research project he is conducting on the relationship between the price of soup and the quantity of soup demanded. He hands you the following document:
|
Price of Soup |
Quantity of Soup Demanded |
|---|---|
|
(Dollars per can) |
(Billions of cans) |
| 0.50 | 2,000 |
| 0.75 | 1,500 |
| 1.00 | 1,000 |
| 1.25 | 750 |
Your task is to take this and construct a graphical representation of the data. In doing so, you determine that as the price of soup rises, the quantity of soup demanded decreases. This confirms the .
Homework Answers
Complete the following table by selecting the term that matches each definition.
|
Definition |
Quantity Demanded |
Demand Curve |
Demand Schedule |
Law of Demand |
|
The claim that, ceteris paribus, the quantity demanded of a good falls when the price of that good rises. (This is the statement of the law of demand that when the price falls, quantity demanded rises and vice versa provided other things remains constant) |
√ |
|||
|
A graphical representation of the relationship between the price of a good and the amount of the good that buyers are willing and able to purchase at various prices. (It is the diagrammatic representation of the demand schedule) |
√ |
|||
|
A table showing the relationship between the price of a good and the amount that buyers are willing and able to purchase at various prices (A demand schedule is the tabular representation of the various quantities demanded at different prices) |
√ |
|||
|
The amount of a good that buyers are willing and able to purchase at a given price. (Demand is the desire backed by willingness to have and ability to pay) |
√ |
Apply your understanding of the previous key terms by completing the following scenario with the appropriate terminology.
Your boss would like your help on a marketing research project he is conducting on the relationship between the price of soup and the quantity of soup demanded. He hands you the following document:
|
Price of Soup |
Quantity of Soup Demanded |
|
(Dollars per can) |
(Billions of cans) |
|
0.50 |
2,000 |
|
0.75 |
1,500 |
|
1.00 |
1,000 |
|
1.25 |
750 |
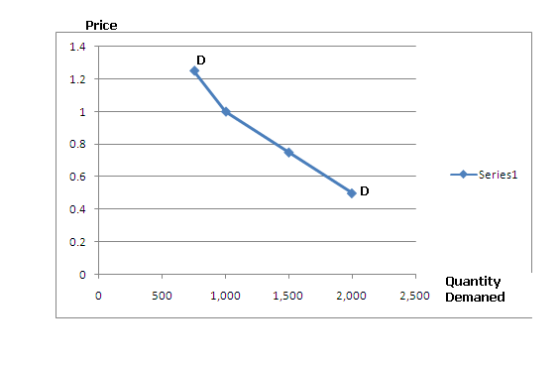
Your task is to take this demand schedule and construct a graphical representation of the data. In doing so, you determine that as the price of soup rises, the quantity of soup demanded decreases. This confirms the Law of Demand.
Add Answer to:
Complete the following table by selecting the term that matches
each definition.
Definition
Quantity Demanded
Demand...
Complete the following table by selecting the term that matches each definition
Complete the following table by selecting the term that matches each definition Definition A graphical object showing the relationship between the price of a good and the amount of the good that buyers are willing and able to purchase at various prices A table showing the relationship between the price of a good and the amount that buyers are willing and able to purchase at various prices The claim that, with other things being equal, the quantity demanded of a good falls when the...
Hi sir/ma'am, may I humbly ask you to help me with this particular micro economics problem...
 Hi sir/ma'am, may I humbly ask you to help me with this
particular micro economics problem please? Thank you for your
help!
1. Demand terminology Complete the following table by selecting the term that matches each definition. Definition Quantity Demanded Demand Curve Demand Schedule Law of Demand The claim that, ceteris paribus, the quantity demanded of a good falls when the price of that good rises 0 A graphical representation of the relationship between the price of a good and...
Hi sir/ma'am, may I humbly ask you to help me with this
particular micro economics problem please? Thank you for your
help!
1. Demand terminology Complete the following table by selecting the term that matches each definition. Definition Quantity Demanded Demand Curve Demand Schedule Law of Demand The claim that, ceteris paribus, the quantity demanded of a good falls when the price of that good rises 0 A graphical representation of the relationship between the price of a good and...
5. Supply: Basic concepts Complete the following table by selecting the term that matches each definition....
5. Supply: Basic concepts Complete the following table by selecting the term that matches each definition. Definition Quantity Supplied Supply Curve Supply Schedule Law of Supply A graphical object showing the relationship between the price of a good and the amount that sellers are willing and able to supply at various prices The claim that, other things being equal, the quantity supplied of a good increases when the price of that good rises A table showing the relationship between the...
5. Supply: Basic concepts Complete the following table by selecting the term that matches each definition...
 5. Supply: Basic concepts Complete the following table by selecting the term that matches each definition Quantity Supply Supply Law of Supplied Curve Schedule Supply Definition The claim that, other things being equal the quantity supplied of a good increases when the price of that good rises A table showing the relationship between the price of a good and the amount of it that sellers are willing and able to supply at various prices The amount of a good that...
For The first drop down menu that I did not expand the options are D2 and...
 For The first drop
down menu that I did not expand the options are D2 and D1
emand terminology mplete the following table by selecting the term that matches each definition. Quantity Demanded Demand Curve Demand Schedule Law of Demand Definition A graphical object showing the relationship between the price of a good and the amount of the good that buyers are willing and able to purchase at various prices A table showing the relationship between the price of a...
For The first drop
down menu that I did not expand the options are D2 and D1
emand terminology mplete the following table by selecting the term that matches each definition. Quantity Demanded Demand Curve Demand Schedule Law of Demand Definition A graphical object showing the relationship between the price of a good and the amount of the good that buyers are willing and able to purchase at various prices A table showing the relationship between the price of a...
1) 2) Complete the following table by selecting the term that matches each definition. Quantity Supply...
 1)
2)
Complete the following table by selecting the term that matches each definition. Quantity Supply Supply Law of Supplied Curve Schedule Supply Definition A graphical object showing the relationship between the price of a good and the amount that sellers are willing and able to supply at various prices The amount of a good that sellers are willing and able to supply at a given price price of that good rises A table showing the relationship between the price...
1)
2)
Complete the following table by selecting the term that matches each definition. Quantity Supply Supply Law of Supplied Curve Schedule Supply Definition A graphical object showing the relationship between the price of a good and the amount that sellers are willing and able to supply at various prices The amount of a good that sellers are willing and able to supply at a given price price of that good rises A table showing the relationship between the price...
A table showing the relationship between the price of a good and the amount of it that sellers are willing and able to supply at various prices
 A table showing the relationship between the price of a good and the amount of it that sellers are willing and able to supply at various prices The claim that, other things being equal, the quantity supplied of a good increases when the price of that good rises A graphical object showing pe relationship between the price of a good and the amount that sellers are willing and able to supply at various prices The amount of a good that sellers are willing...
Q Search this course Homework (Ch 04) S. Supply: Basic Concept Complete the following table by...
 Q Search this course Homework (Ch 04) S. Supply: Basic Concept Complete the following table by selecting the term that matches each definition Definition Quantity Supplied Supply Curve Supply Schedule Law of Supply The amount of a good that sellers are willing and able to supply at a given price A table showing the relationship between the price of a good and the amount of it that sellers are willing and able to supply at various prices A graphical object...
Homework (Ch 04) Quantity Supplied Supply Curve Supply Schedule Law of Supply Definition The claim that...
 Homework (Ch 04) Quantity Supplied Supply Curve Supply Schedule Law of Supply Definition The claim that other things being equal, the quantity supplied of a good increases when the price of that good rises A graphical object showing the relationship between the price of a good and the amount that sellers are willing and able to supply at various prices ne that 0 0 The amount of a good that sellers are willing and able to supply at a given...
From the list on your right select the letter that contains the word phrase, name, etc...
 From the list on your right select the letter that contains the word phrase, name, etc that best matches the word, phrase, name, ele listed on the A The Law of Supply B. Equilibrium C. An example of price floor The total amount of goods and services consumers are willing and able to purchase at a given price. D. Substitutes Other things remaining the same ar ather things being equal E. Demand Positive or direct relationship between price and quantity...
 Hi sir/ma'am, may I humbly ask you to help me with this
particular micro economics problem please? Thank you for your
help!
1. Demand terminology Complete the following table by selecting the term that matches each definition. Definition Quantity Demanded Demand Curve Demand Schedule Law of Demand The claim that, ceteris paribus, the quantity demanded of a good falls when the price of that good rises 0 A graphical representation of the relationship between the price of a good and...
Hi sir/ma'am, may I humbly ask you to help me with this
particular micro economics problem please? Thank you for your
help!
1. Demand terminology Complete the following table by selecting the term that matches each definition. Definition Quantity Demanded Demand Curve Demand Schedule Law of Demand The claim that, ceteris paribus, the quantity demanded of a good falls when the price of that good rises 0 A graphical representation of the relationship between the price of a good and...
 5. Supply: Basic concepts Complete the following table by selecting the term that matches each definition Quantity Supply Supply Law of Supplied Curve Schedule Supply Definition The claim that, other things being equal the quantity supplied of a good increases when the price of that good rises A table showing the relationship between the price of a good and the amount of it that sellers are willing and able to supply at various prices The amount of a good that...
 For The first drop
down menu that I did not expand the options are D2 and D1
emand terminology mplete the following table by selecting the term that matches each definition. Quantity Demanded Demand Curve Demand Schedule Law of Demand Definition A graphical object showing the relationship between the price of a good and the amount of the good that buyers are willing and able to purchase at various prices A table showing the relationship between the price of a...
For The first drop
down menu that I did not expand the options are D2 and D1
emand terminology mplete the following table by selecting the term that matches each definition. Quantity Demanded Demand Curve Demand Schedule Law of Demand Definition A graphical object showing the relationship between the price of a good and the amount of the good that buyers are willing and able to purchase at various prices A table showing the relationship between the price of a...
 1)
2)
Complete the following table by selecting the term that matches each definition. Quantity Supply Supply Law of Supplied Curve Schedule Supply Definition A graphical object showing the relationship between the price of a good and the amount that sellers are willing and able to supply at various prices The amount of a good that sellers are willing and able to supply at a given price price of that good rises A table showing the relationship between the price...
1)
2)
Complete the following table by selecting the term that matches each definition. Quantity Supply Supply Law of Supplied Curve Schedule Supply Definition A graphical object showing the relationship between the price of a good and the amount that sellers are willing and able to supply at various prices The amount of a good that sellers are willing and able to supply at a given price price of that good rises A table showing the relationship between the price...
 A table showing the relationship between the price of a good and the amount of it that sellers are willing and able to supply at various prices The claim that, other things being equal, the quantity supplied of a good increases when the price of that good rises A graphical object showing pe relationship between the price of a good and the amount that sellers are willing and able to supply at various prices The amount of a good that sellers are willing...
 Q Search this course Homework (Ch 04) S. Supply: Basic Concept Complete the following table by selecting the term that matches each definition Definition Quantity Supplied Supply Curve Supply Schedule Law of Supply The amount of a good that sellers are willing and able to supply at a given price A table showing the relationship between the price of a good and the amount of it that sellers are willing and able to supply at various prices A graphical object...
 Homework (Ch 04) Quantity Supplied Supply Curve Supply Schedule Law of Supply Definition The claim that other things being equal, the quantity supplied of a good increases when the price of that good rises A graphical object showing the relationship between the price of a good and the amount that sellers are willing and able to supply at various prices ne that 0 0 The amount of a good that sellers are willing and able to supply at a given...
 From the list on your right select the letter that contains the word phrase, name, etc that best matches the word, phrase, name, ele listed on the A The Law of Supply B. Equilibrium C. An example of price floor The total amount of goods and services consumers are willing and able to purchase at a given price. D. Substitutes Other things remaining the same ar ather things being equal E. Demand Positive or direct relationship between price and quantity...
Most questions answered within 3 hours.
-
Write a program to solve the Josephus problem, with the following
modification:
Sample Input:
./a.out n...
asked 2 hours ago -
At the start of a CD it is spinning at a rate of 525 rpm
(revolutions...
asked 3 hours ago -
4. Without doing any calculations, predict whether the observed
∆T would increase, decrease or remain the...
asked 4 hours ago -
Based on the range, which of the following sets of scores has
the greatest variability? 3,...
asked 5 hours ago -
Ripples in a pond travel at a velocity of 3 m/s with one peak
passing a...
asked 5 hours ago -
A man stands on the roof of a building of height 13.0 mm and
throws a...
asked 5 hours ago -
The extent to which assets are financed by borrowed funds and
other liabilities is indicated by:...
asked 6 hours ago -
Explain in detail
Germany is the fifth largest economy
explain what goods and services Germany specializes...
asked 6 hours ago -
The density of platinum is 21.45 g/mL. If a cube of platinum
with a mass of...
asked 6 hours ago -
Accounts Receivable
Sales
A/R Posting
Extended Sales Invoice
Packing Slip
Compare invoice to packing slip 2...
asked 6 hours ago -
Michaella, age 23, is a full-time law student and is claimed by
her parents as a...
asked 6 hours ago -
Why are polymers not typically casted into products?
asked 7 hours ago