11. Problems and Applications Q11 Suppose that the price of basketball tickets at your college is...
11. Problems and Applications Q11
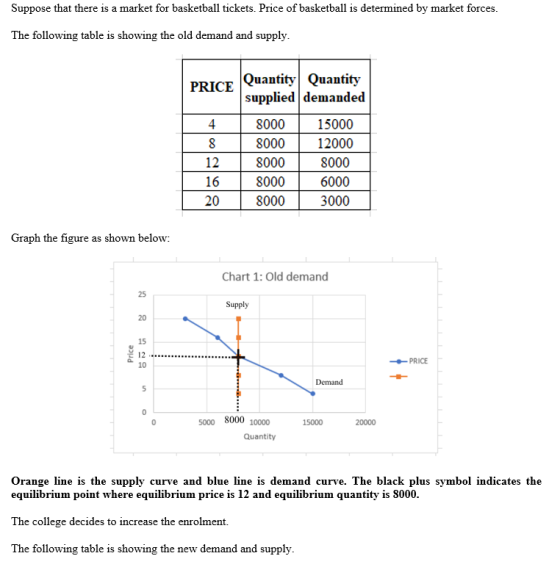
Suppose that the price of basketball tickets at your college is determined by market forces. Currently, the demand and supply schedules are as follows:
|
Price |
Quantity Demanded |
Quantity Supplied |
|---|---|---|
|
(Dollars) |
(Tickets) |
(Tickets) |
| 4 | 15,000 | 8,000 |
| 8 | 12,000 | 8,000 |
| 12 | 8,000 | 8,000 |
| 16 | 6,000 | 8,000 |
| 20 | 3,000 | 8,000 |
Use the blue points (circle symbol) to graph the demand for basketball tickets. Then use the orange points (square symbol) to graph the supply of tickets. Finally, use the black point (plus symbol) to indicate the equilibrium price and quantity in this market.
Original DemandSupplyOriginal EquilibriumNew DemandNew Equilibrium0246810121416182020181614121086420Price of Tickets (Dollars)Quantity of Tickets (Thousands)
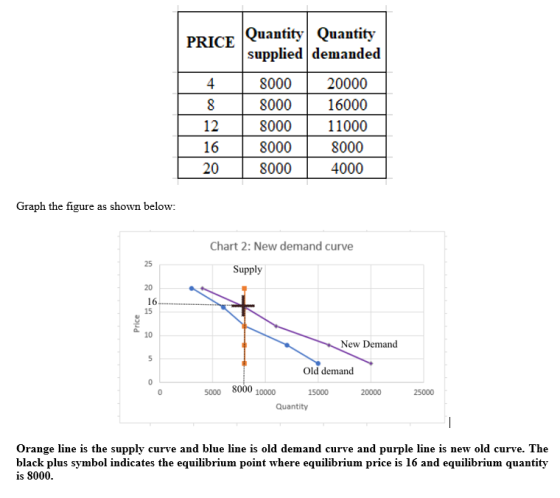
Your college plans to increase total enrollment next year by 6,000 students. The additional students will have the following demand schedule:
|
Price |
Quantity Demanded |
|---|---|
|
(Dollars) |
(Tickets) |
| 4 | 5,000 |
| 8 | 4,000 |
| 12 | 3,000 |
| 16 | 2,000 |
| 20 | 1,000 |
Add the old demand schedule and the demand schedule for the new students to calculate the new demand schedule for the entire college. Use the purple points (diamond symbol) to draw this new demand curve on the previous graph. Then use the grey point (star symbol) to indicate the new equilibrium price and quantity.
Homework Answers
Add Answer to:
11. Problems and Applications Q11
Suppose that the price of basketball tickets at your college is...
Suppose that the price of basketball tickets at your college is determined by market forces. Currently, the demand and supply schedules are as follows:
11. Problems and Applications Q11Suppose that the price of basketball tickets at your college is determined by market forces. Currently, the demand and supply schedules are as follows:PriceQuantity DemandedQuantity Supplied(Dollars)(Tickets)(Tickets)415,0008,000812,0008,000128,0008,000166,0008,000203,0008,000Use the blue points (circle symbol) to graph the demand for basketball tickets. Then use the orange points (square symbol) to graph the supply of tickets. Finally, use the black point (plus symbol) to indicate the equilibrium price and quantity in this market.Original DemandSupplyOriginal EquilibriumNew DemandNew Equilibrium0246810121416182020181614121086420Price of Tickets (Dollars)Quantity of...
There is a shortage of college basketball and football tickets for some games, and a surplus...
 There is a shortage of college basketball and football tickets for some games, and a surplus occurs for other games The following graph shows the market for the football team home games. Suppose that your favorite football team has a stadium that seats 15,000 people and that for every game during the season, the football team administrators charge $15 for tickets. The demand curve for the tickets for the top-of-the-league games is labeled DTop and the demand curve for the...
just looking for answer to d. does adding students effect both curves? or just demand curve?...
 just looking for answer to d. does adding students
effect both curves? or just demand curve?
Unit 2 Steview Problems + -31738298cmid=24097628page-1 Suppose that the price of basketbalikat at your college is determined by market forces. Currently, the demand and supply schedules are as below: Price Quantity Demanded Quantity Supplied 10,000 2,000 8,000 4,000 6.000 6,000 4,000 8,000 2,000 10,000 # Using the above data to graph the demand and supply curves in one diagram and identify the equilibrium point...
just looking for answer to d. does adding students
effect both curves? or just demand curve?
Unit 2 Steview Problems + -31738298cmid=24097628page-1 Suppose that the price of basketbalikat at your college is determined by market forces. Currently, the demand and supply schedules are as below: Price Quantity Demanded Quantity Supplied 10,000 2,000 8,000 4,000 6.000 6,000 4,000 8,000 2,000 10,000 # Using the above data to graph the demand and supply curves in one diagram and identify the equilibrium point...
Consider a college town where the initial price of rental apartments is $500 and the initial quantity is 3,000 apartmen...
Consider a college town where the initial price of rental apartments is $500 and the initial quantity is 3,000 apartments. The price elasticity of demand for apartments is 1.25, and the price elasticity of supply of apartments is 0.75. Use demand and supply curves to show the initial equilibrium, an label the equilibrium point a. Suppose that an increase in college enrollment is expected to increase the demand for apartments in the college town by 30 percent. Use your graph...
The market price of cheeseburgers in a college town decreased recently, and the students in an...
 The market price of cheeseburgers in a college town decreased recently, and the students in an economics class are debating the cause of the price decrease. Some students suggest that the price decreased because several new burger joints have recently opened in the area. Other students attribute the decrease in the price of cheeseburgers to a recent decrease in college student enrollment. The first group of students thinks the decrease in the price of cheeseburgers is due to the fact...
Seved Suppose the following data represent the market demand for college education: Tuition (per year) $1,000...
 Seved Suppose the following data represent the market demand for college education: Tuition (per year) $1,000 $2,000$3,000 $4,000 $5,000 $6,000$7,000$8,000|| Enrollment demanded (in millions per year) 8 7 6 5 4 3 2 (a) If tuition is set at $3,000, how many students will enroll? Instructions: Enter your response to the nearest whole number. million students Now suppose that society gets an external benefit of $1,000 for every enrolled student. (b) Draw the social and market demand curves for this...
The market price of hamburgers in a college town decreased recently, and the students in an economics class are debating the cause of the price decrease
 The market price of hamburgers in a college town decreased recently, and the students in an economics class are debating the cause of the price decrease. Some students suggest that the price decreased because several new burger joints have recently opened in the area. Other students attribute the decrease in the price of hamburgers to a recent decrease in college student enrollment. The first group of students thinks the decrease in the price of hamburgers is due to the fact that...
15. Another supply and demand puzzle The market price of pizzas in a college town decreased...
 15. Another supply and demand puzzle The market price of pizzas in a college town decreased recently, and the students in an economics class are debating the cause of the price decrease. Some students suggest that the price decreased because the price of dough, an important ingredient for making pizzas, has decreased. Other students attribute the decrease in the price of pizzas to a recent decrease in college student enrollment. The first group of students thinks the decrease in the...
5. Problems and Applications Q5 The nation of Textilia does not allow imports of clothing. In...
 5. Problems and Applications Q5 The nation of Textilia does not allow imports of clothing. In its equilibrium without trade, a T-shirt costs $20, and the equilibrium quantity is 3 million T-shirts. One day, after reading Adam Smith's The Wealth of Nations while on vacation, the president decides to open the Textilian market to international trade. The market price of a T-shirt falls to the world price of $16. The number of T-shirts consumed in Textilia rises to 4 million,...
Price (Dollars per TV set) Quantity Demanded Quantity Supplied 100 900 200 700 200 500 300...
 Price (Dollars per TV set) Quantity Demanded Quantity Supplied 100 900 200 700 200 500 300 400 550 400 600 900 Use blue points (circle symbol) to plot Venezuela's demand curve on the following graph. Use orange points (square symbol) to plot Venezuela's supply curve. Then use the black point (cross symbol) to indicate the domestic market equilibrium. (Hint: Use all of the given points to plot the demand and supply curves.) Demand O Supply PRICE (Dollars per TV set)...
 There is a shortage of college basketball and football tickets for some games, and a surplus occurs for other games The following graph shows the market for the football team home games. Suppose that your favorite football team has a stadium that seats 15,000 people and that for every game during the season, the football team administrators charge $15 for tickets. The demand curve for the tickets for the top-of-the-league games is labeled DTop and the demand curve for the...
 just looking for answer to d. does adding students
effect both curves? or just demand curve?
Unit 2 Steview Problems + -31738298cmid=24097628page-1 Suppose that the price of basketbalikat at your college is determined by market forces. Currently, the demand and supply schedules are as below: Price Quantity Demanded Quantity Supplied 10,000 2,000 8,000 4,000 6.000 6,000 4,000 8,000 2,000 10,000 # Using the above data to graph the demand and supply curves in one diagram and identify the equilibrium point...
just looking for answer to d. does adding students
effect both curves? or just demand curve?
Unit 2 Steview Problems + -31738298cmid=24097628page-1 Suppose that the price of basketbalikat at your college is determined by market forces. Currently, the demand and supply schedules are as below: Price Quantity Demanded Quantity Supplied 10,000 2,000 8,000 4,000 6.000 6,000 4,000 8,000 2,000 10,000 # Using the above data to graph the demand and supply curves in one diagram and identify the equilibrium point...
 The market price of cheeseburgers in a college town decreased recently, and the students in an economics class are debating the cause of the price decrease. Some students suggest that the price decreased because several new burger joints have recently opened in the area. Other students attribute the decrease in the price of cheeseburgers to a recent decrease in college student enrollment. The first group of students thinks the decrease in the price of cheeseburgers is due to the fact...
 Seved Suppose the following data represent the market demand for college education: Tuition (per year) $1,000 $2,000$3,000 $4,000 $5,000 $6,000$7,000$8,000|| Enrollment demanded (in millions per year) 8 7 6 5 4 3 2 (a) If tuition is set at $3,000, how many students will enroll? Instructions: Enter your response to the nearest whole number. million students Now suppose that society gets an external benefit of $1,000 for every enrolled student. (b) Draw the social and market demand curves for this...
 15. Another supply and demand puzzle The market price of pizzas in a college town decreased recently, and the students in an economics class are debating the cause of the price decrease. Some students suggest that the price decreased because the price of dough, an important ingredient for making pizzas, has decreased. Other students attribute the decrease in the price of pizzas to a recent decrease in college student enrollment. The first group of students thinks the decrease in the...
 5. Problems and Applications Q5 The nation of Textilia does not allow imports of clothing. In its equilibrium without trade, a T-shirt costs $20, and the equilibrium quantity is 3 million T-shirts. One day, after reading Adam Smith's The Wealth of Nations while on vacation, the president decides to open the Textilian market to international trade. The market price of a T-shirt falls to the world price of $16. The number of T-shirts consumed in Textilia rises to 4 million,...
 Price (Dollars per TV set) Quantity Demanded Quantity Supplied 100 900 200 700 200 500 300 400 550 400 600 900 Use blue points (circle symbol) to plot Venezuela's demand curve on the following graph. Use orange points (square symbol) to plot Venezuela's supply curve. Then use the black point (cross symbol) to indicate the domestic market equilibrium. (Hint: Use all of the given points to plot the demand and supply curves.) Demand O Supply PRICE (Dollars per TV set)...
Most questions answered within 3 hours.
-
How does use of the risk/need/responsivity model impact
effective rehabilitation services?
asked 57 seconds ago -
Your rich uncle has just given you a high school graduation
present of $900,000. The present,...
asked 3 minutes ago -
1=Write a program in C to get 16-bit data from Port-D and send
it to ports...
asked 2 minutes ago -
Calculate Ecell for the following reaction and conditions: 0.50
M Br2 (aq), 0.10 M Pb+2 (aq),...
asked 22 minutes ago -
There can be more than one correct answer.
Hypophysiotropic hormones:
A. released by the hypothalamus
B....
asked 28 minutes ago -
Scott Ruskin is the CEO of Decatur Materials. The company has
been struggling for the last...
asked 26 minutes ago -
If you were conducting a study involving twins regarding
genetics and/or upbringing, which would you use?...
asked 47 minutes ago -
Part 1- Inventory: You own a toy company and
you are producing wooden rocking horses. Assume...
asked 56 minutes ago -
What is aromaticity?
Identify aromatic molecules, especially those containing O, N,
S and B
asked 59 minutes ago -
A rubber solid circular wheel of uniform density spins about it
axis at rate of 60...
asked 1 hour ago -
DNA evidence from an early human skeleton in Britain, shows that
early inhabitants of were blue...
asked 1 hour ago -
Financial data for Joel de Paris, Inc., for last year
follow:
Joel de Paris, Inc.
Balance...
asked 1 hour ago