The following graph shows the demand curve for a group of consumers in the U.S. market (blue line) for tablets.
The following graph shows the demand curve for a group of consumers in the U.S. market (blue line) for tablets. The market price of a tablet is shown by the black horizontal line at $120.
Each rectangle you can place on the following graph corresponds to a particular buyer in this market: orange (square symbols) for Dmitri, green (triangle symbols) for Frances, purple (diamond symbols) for Jake, tan (dash symbols) for Latasha, and blue (circle symbols) for Nick. Use the rectangles to shade the areas representing consumer surplus for each person who is willing and able to purchase a tablet at a market price of $120. (Note: If a person will not purchase a tablet at the market price, indicate this by leaving his or her rectangle in its original position on the palette.)

Based on the information on the previous graph, you can tell that (1/2/3/4/5 consumers) will buy tablets at the given market price, and total consumer surplus in this market will be $______.
Suppose the market price of a tablet decreases to $60.
On the following graph, use the rectangles once again to shade the areas representing consumer surplus for each person who is willing and able to purchase a tablet at the new market price: orange (square symbols) for Dmitri, green (triangle symbols) for Frances, purple (diamond symbols) for Jake, tan (dash symbols) for Latasha, and blue (circle symbols) for Nick. (Note: If a person will not purchase a tablet at the new market price, indicate this by leaving his or her rectangle in its original position on the palette.)

Based on the information in the second graph, when the market price of a tablet decreases to $60, the number of consumers willing to buy a tablet (decreases/increases) to (1/2/3/4/5 consumers) , and total consumer surplus (decreases/increases) to $______.
Homework Answers

a) 3 consumers
b) Total consumer surplus = (225 - 120)(1 - 0) + (195 - 120)(2 - 1) + (150 - 120)(3 - 2) = 105 + 75 + 30 = 210
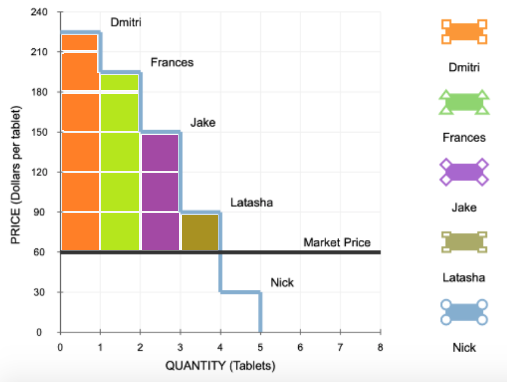
c) Increases to 4 consumers
d) Consumer surplus increases
New C.S = (225 - 60)(1 - 0) + (195 - 60)(2 - 1) + (150 - 60)(3 - 2) + (90 - 60)(4 - 3) = 165 + 135 + 90 + 30 = 420
Add Answer to:
The following graph shows the demand curve for a group of consumers in the U.S. market (blue line) for tablets.
(Decreases/increases) ,(1,2,3,4, 5 customers),(Decreases/increases) 3. Consumer surplus for a group of consumers The following graph shows...
 (Decreases/increases) ,(1,2,3,4, 5
customers),(Decreases/increases)
3. Consumer surplus for a group of consumers The following graph shows the demand curve for a group of consumers in the U.S. market (blue line) for laptops. The market price of a laptop is shown by the black horizontal line at $150 Each rectangle you can place on the following graph corresponds to a particular buyer in this market: orange (square symbols) for Dmitri, green (triangle symbols) for Frances, purple (diamond symbols) for Jake, tan...
(Decreases/increases) ,(1,2,3,4, 5
customers),(Decreases/increases)
3. Consumer surplus for a group of consumers The following graph shows the demand curve for a group of consumers in the U.S. market (blue line) for laptops. The market price of a laptop is shown by the black horizontal line at $150 Each rectangle you can place on the following graph corresponds to a particular buyer in this market: orange (square symbols) for Dmitri, green (triangle symbols) for Frances, purple (diamond symbols) for Jake, tan...
The following graph shows the demand curve for a group of consumers in the U.S. market (blue line) for smartphones.
 3. Consumer surplus for a group of consumers The following graph shows the demand curve for a group of consumers in the U.S. market (blue line) for smartphones. The market price of a smartphone is shown by the black horizontal line at $120. Each rectangle you can place on the following graph corresponds to a particular buyer in this market: orange (square symbols) for Bob, green (triangle symbols) for Cho, purple (diamond symbols) for Eric, tan (dash symbols) for Ginny, and blue...
The following graph shows the supply curve for a group of sellers in the U.S. market for tablets (orange line)
 The following graph shows the supply curve for a group of sellers in the U.S. market for tablets (orange line). Each seller has only one tablet to sell. The market price of a tablet is shown by the black horizontal line at $175. Each rectangle on the graph corresponds to a particular seller in this market: blue (circle symbols) for Paolo, green (triangle symbols) for Sharon, purple (diamond symbols) for Van, tan (dash symbols) for Amy, and orange (square symbols) for...
Homework (Ch 07) 3. Consumer surplus for a group of consumers The following graph shows the...
 Homework (Ch 07) 3. Consumer surplus for a group of consumers The following graph shows the demand curve for a group of consumers in the U.S. market (blue line) for tablets. The market price of a tablet is by the black horizontal line at $90. Each rectangle you can place on the following graph corresponds to a particular buyer in this market: orange (square symbols) for Andrew, gree (triangle symbols) for Beth, purple (diamond symbols) for Darnell, tan (dash symbols)...
Homework (Ch 07) 3. Consumer surplus for a group of consumers The following graph shows the...
 Homework (Ch 07) 3. Consumer surplus for a group of consumers The following graph shows the demand curve for a group of consumers in the U.S. market (blue line) for tablets. The market price of a tablet is shown by the black horizontal line at $150. Each rectangle you can place on the following graph corresponds to a particular buyer in this market: orange (square symbols) for Carlos, green (triangle symbols) for Deborah, purple (diamond symbols) for Felix, tan (dash...
The following graph shows the demand curve for a group of consumers in the U.S. market...
 The following graph shows the demand curve for a group of consumers in the U.S. market (blue line) for smartphones. The market price of a smartphone is shown by the black horizontal line at $150 Each rectangle you can place on the following graph corresponds to a particular buyer in this market: orange (square symbols) for Clancy, green (triangle symbols) for Eileen, purple (diamond symbols) for Hubert, tan (dash symbols) for Kate, and blue (circle symbols) for Manuel. Use the...
3. Consumer surplus for a group of consumers The following graph shows the demand curve for...
 3. Consumer surplus for a group of consumers The following graph shows the demand curve for a group of consumers in the U.S. market (blue line) for smartphones. The market price of a smartphone is shown by the black horizontal line at $150. Each rectangle you can place on the following graph corresponds to a particular buyer in this market: orange (square symbols) for Bob, green (triangle symbols) for Cha, purple (diamond symbols) for Eric, tan (dash symbols) for Ginny,...
3. Consumer surplus for a group of consumers The following graph shows the demand curve for...
 3. Consumer surplus for a group of consumers The following graph shows the demand curve for a group of consumers in the U.S. market (blue line) for laptops. The market price of a laptop is shown by the black horizontal line at $90 Each rectangle you can place on the following graph corresponds to a particular buyer in this market: orange (square symbols) for Alex, green (triangle symbols) for Becky, purple (diamond symbols) for Clancy, tan (dash symbols) for Eileen,...
3. Consumer surplus for a group of consu The following graph shows the demand curve for...
 3. Consumer surplus for a group of consu The following graph shows the demand curve for a group of consumers in the U.S. market (blue Ine) for smartphones. The market price of a smartphone is shown by the black horizontal Ine at $120. Each rectangle you can paco on the folowig graph ตrresponds to a parttular buyer in this market omge (sean symbok, for Raj, geen (trlangle symbols) for Simone, purple (diamond symbols) for Yakoy, tan (dash symbols) for Ana,...
Has 2 graphs and questions. thank you for your 5. Producer surplus for a group of...
 Has
2 graphs and questions. thank you for your
5. Producer surplus for a group of sellers The following graph shows the supply curve for a group of sellers in the U.S. market for laptops (orange line). Each seller has only one laptop to sell. The market price of a laptop is shown by the black horizontal line at $105. Each rectangle on the graph corresponds to a particular seller in this market: blue (circle symbols) for lake, green (triangle...
Has
2 graphs and questions. thank you for your
5. Producer surplus for a group of sellers The following graph shows the supply curve for a group of sellers in the U.S. market for laptops (orange line). Each seller has only one laptop to sell. The market price of a laptop is shown by the black horizontal line at $105. Each rectangle on the graph corresponds to a particular seller in this market: blue (circle symbols) for lake, green (triangle...
 (Decreases/increases) ,(1,2,3,4, 5
customers),(Decreases/increases)
3. Consumer surplus for a group of consumers The following graph shows the demand curve for a group of consumers in the U.S. market (blue line) for laptops. The market price of a laptop is shown by the black horizontal line at $150 Each rectangle you can place on the following graph corresponds to a particular buyer in this market: orange (square symbols) for Dmitri, green (triangle symbols) for Frances, purple (diamond symbols) for Jake, tan...
(Decreases/increases) ,(1,2,3,4, 5
customers),(Decreases/increases)
3. Consumer surplus for a group of consumers The following graph shows the demand curve for a group of consumers in the U.S. market (blue line) for laptops. The market price of a laptop is shown by the black horizontal line at $150 Each rectangle you can place on the following graph corresponds to a particular buyer in this market: orange (square symbols) for Dmitri, green (triangle symbols) for Frances, purple (diamond symbols) for Jake, tan...
 Homework (Ch 07) 3. Consumer surplus for a group of consumers The following graph shows the demand curve for a group of consumers in the U.S. market (blue line) for tablets. The market price of a tablet is by the black horizontal line at $90. Each rectangle you can place on the following graph corresponds to a particular buyer in this market: orange (square symbols) for Andrew, gree (triangle symbols) for Beth, purple (diamond symbols) for Darnell, tan (dash symbols)...
 Homework (Ch 07) 3. Consumer surplus for a group of consumers The following graph shows the demand curve for a group of consumers in the U.S. market (blue line) for tablets. The market price of a tablet is shown by the black horizontal line at $150. Each rectangle you can place on the following graph corresponds to a particular buyer in this market: orange (square symbols) for Carlos, green (triangle symbols) for Deborah, purple (diamond symbols) for Felix, tan (dash...
 The following graph shows the demand curve for a group of consumers in the U.S. market (blue line) for smartphones. The market price of a smartphone is shown by the black horizontal line at $150 Each rectangle you can place on the following graph corresponds to a particular buyer in this market: orange (square symbols) for Clancy, green (triangle symbols) for Eileen, purple (diamond symbols) for Hubert, tan (dash symbols) for Kate, and blue (circle symbols) for Manuel. Use the...
 3. Consumer surplus for a group of consumers The following graph shows the demand curve for a group of consumers in the U.S. market (blue line) for smartphones. The market price of a smartphone is shown by the black horizontal line at $150. Each rectangle you can place on the following graph corresponds to a particular buyer in this market: orange (square symbols) for Bob, green (triangle symbols) for Cha, purple (diamond symbols) for Eric, tan (dash symbols) for Ginny,...
 3. Consumer surplus for a group of consumers The following graph shows the demand curve for a group of consumers in the U.S. market (blue line) for laptops. The market price of a laptop is shown by the black horizontal line at $90 Each rectangle you can place on the following graph corresponds to a particular buyer in this market: orange (square symbols) for Alex, green (triangle symbols) for Becky, purple (diamond symbols) for Clancy, tan (dash symbols) for Eileen,...
 3. Consumer surplus for a group of consu The following graph shows the demand curve for a group of consumers in the U.S. market (blue Ine) for smartphones. The market price of a smartphone is shown by the black horizontal Ine at $120. Each rectangle you can paco on the folowig graph ตrresponds to a parttular buyer in this market omge (sean symbok, for Raj, geen (trlangle symbols) for Simone, purple (diamond symbols) for Yakoy, tan (dash symbols) for Ana,...
 Has
2 graphs and questions. thank you for your
5. Producer surplus for a group of sellers The following graph shows the supply curve for a group of sellers in the U.S. market for laptops (orange line). Each seller has only one laptop to sell. The market price of a laptop is shown by the black horizontal line at $105. Each rectangle on the graph corresponds to a particular seller in this market: blue (circle symbols) for lake, green (triangle...
Has
2 graphs and questions. thank you for your
5. Producer surplus for a group of sellers The following graph shows the supply curve for a group of sellers in the U.S. market for laptops (orange line). Each seller has only one laptop to sell. The market price of a laptop is shown by the black horizontal line at $105. Each rectangle on the graph corresponds to a particular seller in this market: blue (circle symbols) for lake, green (triangle...
Most questions answered within 3 hours.
-
When Maria Acosta bought a car 2 and a half
years ago, she borrowed $11,000 for...
asked 7 minutes ago -
package rectangle;
public class Rectangle {
private int height;
private int width;
public...
asked 9 minutes ago -
The Yankee's have a contract with their newly hired manager that
requires a lump sum payment...
asked 28 minutes ago -
A travelling salesman sells milkshake mixing machines and on
average sells 8.9 machines per month. He...
asked 33 minutes ago -
what's the danger in the fact that the market value of a stock
is based on...
asked 47 minutes ago -
Describe how do you feel about the post below and
why?
Listening to the podcast reaffirmed...
asked 56 minutes ago -
To start an avalanche on a mountain slope, an artillery shell is
fired with an initial...
asked 1 hour ago -
The population of bacteria in a culture can be modeled by P left
parenthesis t right...
asked 1 hour ago -
Which factors can prevent permanent fixation of an allele (i.e.
maintain genetic diversity)? Hint: You're going...
asked 1 hour ago -
Compare a two-year bond with two successive one-year bonds in a
situation in which an investor...
asked 1 hour ago -
Chapter 6
Search the internet and find a newspaper example of a price
ceiling, price floor...
asked 1 hour ago -
Sarah Bates, calendar year taxpayer, started a new business on
October 8th. A number of start-up...
asked 1 hour ago