5. Monopoly outcome versus competition outcome consider the daily market for hot dogs in a small...
5. Monopoly outcome versus competition outcome
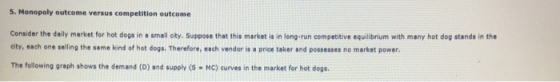
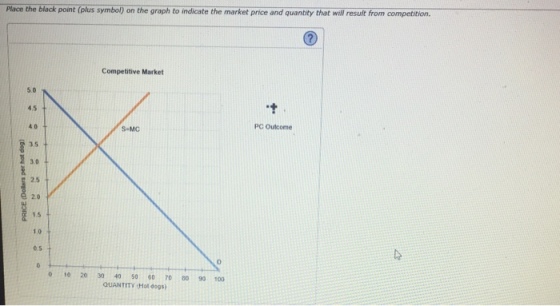
Consider the daily market for hot dogs in a small city. Suppose that this market is in long-run competitive equilibrium with many hot dog stands in the city, each one selling the same kind of hot dogs. Therefore, each vendor is a price taker and possesses no market power.
The following graph shows the demand (D) and supply (S = MC) curves in the market for hot dogs.
Place the block point (plus symbol) on the graph to indicate the market price and quantity that will result from competition.
Assume that one of the hot dog vendors successfully lobbies the city council to obtain the exclusive right to sell hot dogs within the city limits. This firm buys up all the rest of the hot dog vendors in the city and operates as a monopoly. Assume that this change doesn't affect demand and that the new monopoly's marginal cost curve corresponds exactly to the supply curve on the previous graph. Under this assumption, the following graph shows the demand (D), marginal revenue (MR), and marginal cost (MC) curves for the monopoly firm.


Homework Answers
Under perfect competition, the firm would be facing a given price and it would have equated price equal to its rising marginal cost function to determine the optimum level of output. The market demand and supply are equated against each other rto determine the price and market quantity. However, when the demand is downward sloping, the firm would again equate marginal cost MC = marginal revenue MR. This is a monopoly firm.
From the graph, we see that a perfectly competitive market produces 30 hot dogs for a price of $3.5 per hot dog. A monopoly produces 20 hot dogs at a price of $4 per hot dog.
We infer that price is generally higher in monopoly and quantity is generally lower in a monopoly.

Add Answer to:
5. Monopoly outcome versus competition outcome consider the daily market for hot dogs in a small...
5. Monopoly outcome versus competition outcome Consider the daily market for hot dogs in a small...
 5. Monopoly outcome versus competition outcome Consider the daily market for hot dogs in a small city. Suppose that this market is in long-run competitive equilibrium with many hot dog stands in the city, each one selling the same kind of hot dogs. Therefore, each vendor is a price taker and possesses no market power. The following graph shows the demand (D) and supply (S = MC) curves in the market for hot dogs. Place the black point (plus symbol) on the graph...
5. Monopoly outcome versus competition outcome Consider the daily market for hot dogs in a small...
 5. Monopoly outcome versus competition outcomeConsider the daily market for hot dogs in a small city. Suppose that this market is in long-run competitive equilibrium with many hot dog stands in the city, each one selling the same kind of hot dogs. Therefore, each vendor is a price taker and possesses no market power.The following graph shows the demand (D) and supply (S = MC) curves in the market for hot dogs.Place the black point (plus symbol) on the graph...
5. Monopoly outcome versus competition outcome Consider thedaily market for hot dogs in a small...
 5. Monopoly outcome versus competition outcome Consider the
daily market for hot dogs in a small city. Suppose that this market
is in long-run competitive equilibrium with many hot dog stands in
the city, each one selling the same kind of hot dogs. Therefore,
each vendor is a price taker and possesses no market power. The
following graph shows the demand (D) and supply curves (S = MC) in
the market for hot dogs. Place the black point (plus symbol) on...
5. Monopoly outcome versus competition outcome Consider the
daily market for hot dogs in a small city. Suppose that this market
is in long-run competitive equilibrium with many hot dog stands in
the city, each one selling the same kind of hot dogs. Therefore,
each vendor is a price taker and possesses no market power. The
following graph shows the demand (D) and supply curves (S = MC) in
the market for hot dogs. Place the black point (plus symbol) on...
Answer these with thorough explanations, please! 5. Monopoly outcome versus competition outcome Consider the daily market...
 Answer these with thorough explanations, please!
5. Monopoly outcome versus competition outcome Consider the daily market for hot dogs in a small city. Suppose that this market is in long-run competitive equilibrium with many hot dog stands in city, each one selling the same kind of hot dogs. Therefore, each vendor is a price taker and possesses no market power. The following graph shows the demand (D) and supply (S = MC) curves in the market for hot dogs. Place...
Answer these with thorough explanations, please!
5. Monopoly outcome versus competition outcome Consider the daily market for hot dogs in a small city. Suppose that this market is in long-run competitive equilibrium with many hot dog stands in city, each one selling the same kind of hot dogs. Therefore, each vendor is a price taker and possesses no market power. The following graph shows the demand (D) and supply (S = MC) curves in the market for hot dogs. Place...
5. Monopoly outcome versus competition outcome sider the daily market for hot dogs in a small...
 5. Monopoly outcome versus competition outcome sider the daily market for hot dogs in a small city. Suppose that this market is in long-run competitive equilibrium, with many hot dog stands in he city, each one selling the same kind of hot dogs. Therefore, each vendor is a price taker and possesses no market power. The following graph shows the demand (D) and supply curves (S MC) in the market for hot dogs Place the black point (plus symbol) on...
Consider the daily market for hot dogs in asmall city. Suppose that this market is...
 Consider the daily market for hot dogs in a
small city. Suppose that this market is in long-run competitive
equilibrium with many hot dog stands in the city, each one selling
the same kind of hot dogs. Therefore, each vendor is a price taker
and possesses no market power. The following graph shows the demand (D) and supply curves (S = MC) in the market for hot dogs. Place the black point (plus symbol) on the graph to indicate the market price...
Consider the daily market for hot dogs in a
small city. Suppose that this market is in long-run competitive
equilibrium with many hot dog stands in the city, each one selling
the same kind of hot dogs. Therefore, each vendor is a price taker
and possesses no market power. The following graph shows the demand (D) and supply curves (S = MC) in the market for hot dogs. Place the black point (plus symbol) on the graph to indicate the market price...
Competitive market or monopoly for both drop down menus. 5. Monopoly outcome versus competition outcome Consider...
 Competitive market or monopoly for both drop down
menus.
5. Monopoly outcome versus competition outcome Consider the daily market for hot dogs in a small city. Suppose that this market is in long-run competitive equilibrium with many hot dog stands in the city, each one selling the same kind of hot dogs. Therefore, each vendor is a price taker and possesses no market power. The following graph shows the demand (D) and supply (S MC) curves in the market for...
Competitive market or monopoly for both drop down
menus.
5. Monopoly outcome versus competition outcome Consider the daily market for hot dogs in a small city. Suppose that this market is in long-run competitive equilibrium with many hot dog stands in the city, each one selling the same kind of hot dogs. Therefore, each vendor is a price taker and possesses no market power. The following graph shows the demand (D) and supply (S MC) curves in the market for...
CENGAGE | MINDTAP Aplia Homework: Monopoly 5. Monopoly outcome versus competition outcome Consider the daily market...
 CENGAGE | MINDTAP Aplia Homework: Monopoly 5. Monopoly outcome versus competition outcome Consider the daily market for hot dogs in a small city. Suppose that this market is in long-run competitive equilibrium, with many hot dog stands in the city, each one selling the same kind of hot dogs. Therefore, each vendor is a price taker and possesses no market power. The following graph shows the demand (D) and supply curves (S - MC) in the market for hot dogs....
Homework (Ch 15) Consider the daily market for hot dogs in a small city. Suppose that...
 Homework (Ch 15) Consider the daily market for hot dogs in a small city. Suppose that this market is in long-run competitive equilibrium with many hot dog stands in the city, each one selling the same kind of hot dogs. Therefore, each vendor is a price taker and possesses no market power MC) curves in the market for hot dogs The following graph shows the demand (D) and supply (S Place the black point (plus symbol) on the graph to...
Assume that one of the hot dog vendors successfully lobbies the city council to obtain the...
 Assume that one of the hot dog vendors successfully lobbies the city council to obtain the exclusive right to sell hot dogs within the city limits. This firm buys up all the rest of the hot dog vendors in the city and operates as a monopoly. Assume that this change doesn't affect demand and that the new monopoly's marginal-cost curve corresponds exactly to the supply curve on the previous graph. Under this assumption, the following graph shows the demand (D),...
 5. Monopoly outcome versus competition outcome Consider the daily market for hot dogs in a small city. Suppose that this market is in long-run competitive equilibrium with many hot dog stands in the city, each one selling the same kind of hot dogs. Therefore, each vendor is a price taker and possesses no market power. The following graph shows the demand (D) and supply (S = MC) curves in the market for hot dogs. Place the black point (plus symbol) on the graph...
 Answer these with thorough explanations, please!
5. Monopoly outcome versus competition outcome Consider the daily market for hot dogs in a small city. Suppose that this market is in long-run competitive equilibrium with many hot dog stands in city, each one selling the same kind of hot dogs. Therefore, each vendor is a price taker and possesses no market power. The following graph shows the demand (D) and supply (S = MC) curves in the market for hot dogs. Place...
Answer these with thorough explanations, please!
5. Monopoly outcome versus competition outcome Consider the daily market for hot dogs in a small city. Suppose that this market is in long-run competitive equilibrium with many hot dog stands in city, each one selling the same kind of hot dogs. Therefore, each vendor is a price taker and possesses no market power. The following graph shows the demand (D) and supply (S = MC) curves in the market for hot dogs. Place...
 5. Monopoly outcome versus competition outcome sider the daily market for hot dogs in a small city. Suppose that this market is in long-run competitive equilibrium, with many hot dog stands in he city, each one selling the same kind of hot dogs. Therefore, each vendor is a price taker and possesses no market power. The following graph shows the demand (D) and supply curves (S MC) in the market for hot dogs Place the black point (plus symbol) on...
 Competitive market or monopoly for both drop down
menus.
5. Monopoly outcome versus competition outcome Consider the daily market for hot dogs in a small city. Suppose that this market is in long-run competitive equilibrium with many hot dog stands in the city, each one selling the same kind of hot dogs. Therefore, each vendor is a price taker and possesses no market power. The following graph shows the demand (D) and supply (S MC) curves in the market for...
Competitive market or monopoly for both drop down
menus.
5. Monopoly outcome versus competition outcome Consider the daily market for hot dogs in a small city. Suppose that this market is in long-run competitive equilibrium with many hot dog stands in the city, each one selling the same kind of hot dogs. Therefore, each vendor is a price taker and possesses no market power. The following graph shows the demand (D) and supply (S MC) curves in the market for...
 CENGAGE | MINDTAP Aplia Homework: Monopoly 5. Monopoly outcome versus competition outcome Consider the daily market for hot dogs in a small city. Suppose that this market is in long-run competitive equilibrium, with many hot dog stands in the city, each one selling the same kind of hot dogs. Therefore, each vendor is a price taker and possesses no market power. The following graph shows the demand (D) and supply curves (S - MC) in the market for hot dogs....
 Homework (Ch 15) Consider the daily market for hot dogs in a small city. Suppose that this market is in long-run competitive equilibrium with many hot dog stands in the city, each one selling the same kind of hot dogs. Therefore, each vendor is a price taker and possesses no market power MC) curves in the market for hot dogs The following graph shows the demand (D) and supply (S Place the black point (plus symbol) on the graph to...
 Assume that one of the hot dog vendors successfully lobbies the city council to obtain the exclusive right to sell hot dogs within the city limits. This firm buys up all the rest of the hot dog vendors in the city and operates as a monopoly. Assume that this change doesn't affect demand and that the new monopoly's marginal-cost curve corresponds exactly to the supply curve on the previous graph. Under this assumption, the following graph shows the demand (D),...
Most questions answered within 3 hours.
-
Write a program to solve the Josephus problem, with the following
modification:
Sample Input:
./a.out n...
asked 14 minutes ago -
At the start of a CD it is spinning at a rate of 525 rpm
(revolutions...
asked 50 minutes ago -
4. Without doing any calculations, predict whether the observed
∆T would increase, decrease or remain the...
asked 2 hours ago -
Based on the range, which of the following sets of scores has
the greatest variability? 3,...
asked 3 hours ago -
Ripples in a pond travel at a velocity of 3 m/s with one peak
passing a...
asked 3 hours ago -
A man stands on the roof of a building of height 13.0 mm and
throws a...
asked 3 hours ago -
The extent to which assets are financed by borrowed funds and
other liabilities is indicated by:...
asked 4 hours ago -
Explain in detail
Germany is the fifth largest economy
explain what goods and services Germany specializes...
asked 4 hours ago -
The density of platinum is 21.45 g/mL. If a cube of platinum
with a mass of...
asked 4 hours ago -
Accounts Receivable
Sales
A/R Posting
Extended Sales Invoice
Packing Slip
Compare invoice to packing slip 2...
asked 4 hours ago -
Michaella, age 23, is a full-time law student and is claimed by
her parents as a...
asked 4 hours ago -
Why are polymers not typically casted into products?
asked 4 hours ago