Government-imposed taxes cause reductions in the activity that is being taxed
11. The Laffer curve
Government-imposed taxes cause reductions in the activity that is being taxed, which has important implications for revenue collections.
To understand the effect of such a tax, consider the monthly market for vodka. With no tax, the equilibrium quantity is 60 bottles. The following table shows the equilibrium quantity produced and sold in the market for various per unit taxes.
Tax (Dollars per bottle) | Quantity (Bottles) |
|---|---|
| 0 | 60 |
| 20 | 48 |
| 40 | 36 |
| 50 | 30 |
| 60 | 24 |
| 80 | 12 |
| 100 | 0 |
Suppose the government imposes a $20-per-bottle tax on suppliers.
At this tax amount, the equilibrium quantity of vodka is _______ bottles, and the government collects $_______ in tax revenue Now calculate the government's tax revenue if it sets a tax of $0, $20, $40, $50, $60, $80, or $100 per bottle. Using the data you generate, plot a Laffer curve by using the green points (triangle symbol) to plot total tax revenue at each of those tax levels Note: Plot your points in the order in which you would like them connected. Line segments will connect the points automatically.
Now calculate the government's tax revenue if it sets a tax of $0, $20, $40, $50, $60, $80, or $100 per bottle. Using the data you generate, plot a Laffer curve by using the green points (triangle symbol) to plot total tax revenue at each of those tax levels.
Note: Plot your points in the order in which you would like them connected. Line segments will connect the points automatically.

Suppose the government is currently imposing a $60-per-bottle tax on vodka.
True or False: The government can raise its tax revenue by increasing the per-unit tax on vodka.
Homework Answers
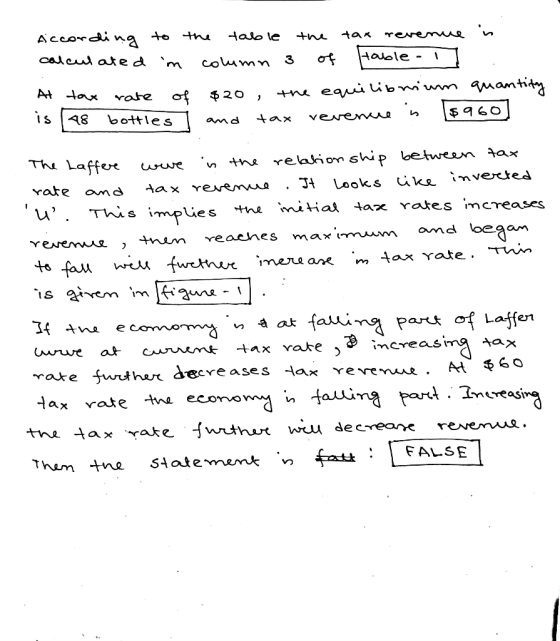
Table 1
| Tax | Q | TR |
| 0 | 60 | 0 |
| 20 | 48 | 960 |
| 40 | 36 | 1440 |
| 60 | 24 | 1440 |
| 80 | 12 | 960 |
| 100 | 0 | 0 |
Figure 1

Add Answer to:
Government-imposed taxes cause reductions in the activity that is being taxed
Government-imposed taxes cause reductions in the activity that is being taxed
 4. The Laffer curveGovernment-imposed taxes cause reductions in the activity that is being taxed, which has important implications for revenue collections. To understand the effect of such a tax, consider the monthly market for cigarettes, which is shown on the following graph.Use the graph input tool to help you answer the following questions. You will not be graded on any changes you make to this graph. Note: Once you enter a value in a white field, the graph and any...
Government-imposed taxes cause reductions in the activity that is being taxed, which has important implications for...
 Government-imposed taxes cause reductions in the activity that is being taxed, which has important implications for revenue collections.To understand the effect of such a tax, consider the monthly market for cigarettes, which is shown on the following graph.Use the graph input tool to help you answer the following questions. You will not be graded on any changes you make to this graph.Note: Once you enter a value in a white field, the graph and any corresponding amounts in each grey...
4. The Laffer curve Government-imposed taxes cause reductions in the activity that is being taxed, which...
 4. The Laffer curve Government-imposed taxes cause reductions in the activity that is being taxed, which has important implications for revenue collections. To understand the effect of such a tax, consider the monthly market for cigarettes, which is shown on the following graph. Use the graph input tool to help you answer the following questions. You will not be graded on any changes you make to this graph. Note: Once you enter a value in a white field, the graph...
Government-imposed taxes cause reductions in the activity that is being taxed, which has important implications for...
 Government-imposed taxes cause reductions in the activity that is being taxed, which has important implications for revenue collections. To understand the effect of such a tax, consider the monthly market for cigarettes, which is shown on the following graph.Use the graph input tool to help you answer the following questions. You will not be graded on any changes you make to this graph. Note: Once you enter a value in a white field, the graph and any corresponding amounts in...
Suppose the government imposes a $20-per-bottle tax on suppliers.
 Suppose the government imposes a $20-per-bottle tax on suppliers.At this tax amount, the equilibrium quantity of gin is _______ bottles, and the government collects $_______ in tax revenue.Now calculate the government's tax revenue if it sets a tax of 50, $20, $40, $50, $60, $80, or $100 per bottle. Hint: To find the equilibrium quantity after the tax, adjust the "Quantity" field until the Tax equals the value of the per-unit tax.) Using the data you generate, plot a Laffer...
Suppose the government imposes a $20-per-bottle tax on suppliers.
 Government-imposed taxes cause reductions in the activity that is being taxed, which has important implications for revenue collections.To understand the effect of such a tax, consider the monthly market for vodka, which is shown on the following graph.Use the graph input tool to help you answer the following questions. You will not be graded on any changes you make to this graph.Note: Once you enter a value in a white field, the graph and any corresponding amounts in each grey...
Governments often place so-called sin taxes on goods or services such as cigarettes, alcohol, and pornography
 Governments often place so-called sin taxes on goods or services
such as cigarettes, alcohol, and pornography. These kinds of taxes
are popular with politicians because they are usually more
palatable to voters than income taxes.To understand the effect of such a tax, consider the monthly
market for vodka, which is shown on the following graph.Use the graph input tool to help you answer the following
questions. You will not be graded on any changes you make to this
graph.Note: Once...
Governments often place so-called sin taxes on goods or services
such as cigarettes, alcohol, and pornography. These kinds of taxes
are popular with politicians because they are usually more
palatable to voters than income taxes.To understand the effect of such a tax, consider the monthly
market for vodka, which is shown on the following graph.Use the graph input tool to help you answer the following
questions. You will not be graded on any changes you make to this
graph.Note: Once...
Suppose the government imposes a $4-per-pack tax on suppliers.
 4. The Laffer curve Government-imposed taxes cause reductions in the activity that is being taxed, which has important implications for revenue collections. To understand the effect of such a tax, consider the monthly market for cigarettes, which is shown on the following graph. Use the graph input tool to help you answer the following questions. You will not be graded on any changes you make to this graph. Note: Once you enter a value in a white field, the graph and any corresponding amounts...
4. The Laffer curve Governments often place so-called sin taxes on goods or services such as ciga...
 4. The Laffer curve Governments often place so-called sin taxes on goods or services such as cigarettes, alcohol, and pornography. These kinds of taxes are popular with politicians because they are usually more palatable to voters than income taxes. To understand the effect of such a tax, consider the monthly market for adult DVDs, which is shown on the following graph Use the graph input tool to help you answer the following questions. You will not be graded on any...
4. The Laffer curve Governments often place so-called sin taxes on goods or services such as...
 4. The Laffer curve Governments often place so-called sin taxes on goods or services such as cigarettes, alcohol, and pornography. These kinds of taxes are popular with politicians because they are usually more palatable to voters than income taxes. To understand the effect of such a tax, consider the monthly market for adult DVDs, which is shown on the following graph Use the graph input tool to help you answer the following questions. You will not be graded on any...
 4. The Laffer curve Government-imposed taxes cause reductions in the activity that is being taxed, which has important implications for revenue collections. To understand the effect of such a tax, consider the monthly market for cigarettes, which is shown on the following graph. Use the graph input tool to help you answer the following questions. You will not be graded on any changes you make to this graph. Note: Once you enter a value in a white field, the graph...
 Suppose the government imposes a $20-per-bottle tax on suppliers.At this tax amount, the equilibrium quantity of gin is _______ bottles, and the government collects $_______ in tax revenue.Now calculate the government's tax revenue if it sets a tax of 50, $20, $40, $50, $60, $80, or $100 per bottle. Hint: To find the equilibrium quantity after the tax, adjust the "Quantity" field until the Tax equals the value of the per-unit tax.) Using the data you generate, plot a Laffer...
 4. The Laffer curve Governments often place so-called sin taxes on goods or services such as cigarettes, alcohol, and pornography. These kinds of taxes are popular with politicians because they are usually more palatable to voters than income taxes. To understand the effect of such a tax, consider the monthly market for adult DVDs, which is shown on the following graph Use the graph input tool to help you answer the following questions. You will not be graded on any...
 4. The Laffer curve Governments often place so-called sin taxes on goods or services such as cigarettes, alcohol, and pornography. These kinds of taxes are popular with politicians because they are usually more palatable to voters than income taxes. To understand the effect of such a tax, consider the monthly market for adult DVDs, which is shown on the following graph Use the graph input tool to help you answer the following questions. You will not be graded on any...
Most questions answered within 3 hours.
-
A grammar is a 4-tuple G, G = (Ν, Σ, Π, Σ, S) where, Ν is...
asked 28 minutes ago -
In this part, calculate the present values. Use the Excel PV
function to compute the present...
asked 27 minutes ago -
Part 1. Primitive Types, Sorting, Recursion for
Homework.java
a) Implement the static method initializeArray that receives...
asked 1 hour ago -
Using C++, build a sorter that can rank a sequence of numbers in
a descending order....
asked 1 hour ago -
Derive ground state term symbols. Use notation 2S(1/2) for state
2S1/2
a) d5
b) f3
c)...
asked 1 hour ago -
A sample of size 31 will be drawn from a population with mean 39
and standard...
asked 2 hours ago -
What is the effect on the P-value when a test is changed from a
two-tailed hypothesis...
asked 2 hours ago -
I wish to estimate µ, the mean of a population. After I collect
and an-
alyze...
asked 3 hours ago -
At a local university, you poll a group of 115 students and find
that 37 of...
asked 2 hours ago -
Gladstone company tracks the number of units purchased and sold
throughout each accounting period but applies...
asked 2 hours ago -
When determining if a molecule's configuration is E or Z, what
determines the higher priority groups?
asked 2 hours ago -
13. What is the amount
of conversion cost transferred to finished goods? (Round
your intermediate calculations...
asked 2 hours ago