Suppose we have the following market supply and demand schedules for bicycles: 1.1. Plot the supply curve and the de...
-
Suppose we have the following market supply and demand schedules for bicycles:
-
1.1. Plot the supply curve and the demand curve for bicycles.
-
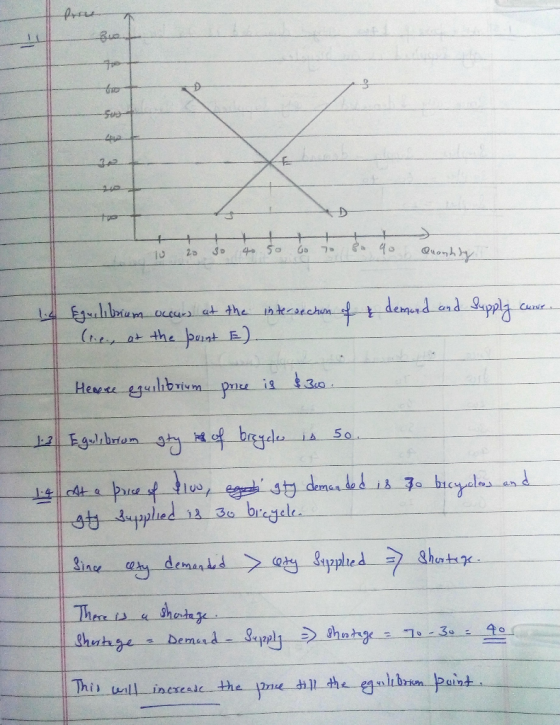
1.2. What is the equilibrium price of bicycles?
-
1.3. What is the equilibrium quantity of bicycles?
-
1.4. If the price of bicycles were $100. Is there a surplus or a shortage? How many units of surplus or shortage are there? Will this cause the price to rise or fall?
-
1.5. Ifthepriceofbicycleswere$400, is there a surplus or a shortage? How many units of surplus or shortage are there? Will this cause the price to rise or fall?
-
1.6. Supposethatthebicyclemaker'slaborunionbargainsforanincreaseinitswages.Furthermore, suppose this event raises the cost of production, makes bicycle manufacturing less profitable, and reduces the quantity supplied of bicycles by 20 units at each price of bicycles. Plot the new supply curve and the original supply and demand curves. What are the new equilibrium price and quantity in the market for bicycles?
-
| PRICE | QUANTITY DEMANDED | QUANTITY SUPPLIED |
| $100 | 70 | 30 |
| 200 | 60 | 40 |
| 300 | 50 | 50 |
| 400 | 40 | 60 |
| 500 | 30 | 70 |
| 600 | 20 | 80 |
Homework Answers

Add Answer to:
Suppose we have the following market supply and demand schedules for bicycles: 1.1. Plot the supply curve and the de...
Using the Supply and Demand Schedules to answer the following questions Table 1 Quantity Quantity Supplied...
 Using the Supply and Demand Schedules to answer the following questions Table 1 Quantity Quantity Supplied Demand Price 100 30 70 200 40 60 300 50 50 40 400 60 500 70 30 600 80 20 3a. Draw the Supply and Demand graph and label. Show the area for the shortage, surplus, and market equilibrium point demand curve to list inan of ft tw lis determinants of the supply curve to shift outward.
Using the Supply and Demand Schedules to...
Using the Supply and Demand Schedules to answer the following questions Table 1 Quantity Quantity Supplied Demand Price 100 30 70 200 40 60 300 50 50 40 400 60 500 70 30 600 80 20 3a. Draw the Supply and Demand graph and label. Show the area for the shortage, surplus, and market equilibrium point demand curve to list inan of ft tw lis determinants of the supply curve to shift outward.
Using the Supply and Demand Schedules to...
Suppose there exists a market for bicycles. The supply and the demand curves in this market...
Suppose there exists a market for bicycles. The supply and the demand curves in this market are given by the following equations where P is the price per bicycle measured in dollars and Q is the quantity of bicycles: Market Demand Curve: P = 1500 – 3Q Market Supply Curve: P = Q + 300. Given the above information and holding everything else constant, find the equilibrium price and quantity in this market.
Use the supply and demand schedule below to answer the following questions: Price Quantity Demand Quantity...
Use the supply and demand schedule below to answer the following questions: Price Quantity Demand Quantity Supplied $15 80 40 25 70 50 35 60 60 45 50 70 55 40 80 a. What is the market equilibrium price and quantity? b. If there is a shortage of 20 units, what is the market price? c. c. At a price of $45, the market experiences a surplus of how many units?
18 Suppose that the demand and supply schedules for rental apartments in the city of Gotham...
18 Suppose that the demand and supply schedules for rental apartments in the city of Gotham are as given in the table below. Instructions: Enter your answers as whole numbers. a. What is the market equilibrium rental price per month and the market equilibrium number of apartments demanded and supplied? Market equilibrium rental price is: Market equilibrium quantity is: b. If the local government can enforce a rent-control law that sets the maximum monthly rent at $1,500, will there be...
Suppose that the demand and supply schedules for rental apartments in the city of Gotham are...
Suppose that the demand and supply schedules for rental apartments in the city of Gotham are as given in the table below. Instructions: Enter your answers as whole numbers. a. What is the market equilibrium rental price per month and the market equilibrium number of apartments demanded and supplied? Market equilibrium rental price is: Market equilibrium quantity is: b. If the local government can enforce a rent-control law that sets the maximum monthly rent at $1,500, will there...
Suppose that the market inverse demand and supply schedules for rental apartments in the city of...
Suppose that the market inverse demand and supply schedules for rental apartments in the city of Auckland are as given by the following equations: Demand: P = 2700 – 0.12QD Supply: P = –300 + 0.12QS What is the market equilibrium rental price per month and the market equilibrium number of apartments demanded and supplied? Show on graph If the local authority can enforce a rent-control law that sets the maximum monthly rent at $900, will there be a...
on 10 of 10 > Consider the supply and demand schedules for calzones at a local...
 on 10 of 10 > Consider the supply and demand schedules for calzones at a local pizzeria. Use the information in the schedules to answer the five questions. Demand Price (P) Quantity (Q) $13 S12 S11 SIO 59 $8 $7 56 55 54 20 40 60 80 100 120 140 160 180 20 Supply Price (P) Quantity (0 $4 55 56 57 $8 89 $10 SL $12 $13 20 30 40 50 60 70 80 90 100 110 What is...
Exhibit 7. Suppose that in a recent market period, the following relationship existed between the price...
 Exhibit 7. Suppose that in a recent market period, the following relationship existed between the price of tablet devices and the quantity supplied and quantity demanded. Price 5330 $340 $350 S360 Quantity Demanded 100 million 90 million 80 milliorn 70 million Quantity Supplied 40 million 60 million 80 million 100 million S370ich 29-Graph the supply and demand curves for tablet devices using the information in the table. What are the equilibrium price and 60 million 120 million quantity? 30- In...
11-1.The market for pizza has the demand and supply schedules as the table 1.1 Graph (plot)...
 11-1.The market for pizza has the demand and supply schedules as the table 1.1 Graph (plot) the demand and supply curve by using the information of the demand and supply schedule in the table. Total She t the point,of derhand andsupply at each given price level. Demand and Supply Sehedule 4-4-44-- 104 81 68 53 39 26 pizzas 53 81 98 S6 S8 59 34 121 For ploting demands iag the belowgivn s0 For ploting supplies, drag the below given...
Suppose that unusually cold weather causes the demand curve for ice cream to shift to the...
 Suppose that unusually cold weather causes the demand curve for ice cream to shift to the left. Why will the price of ice cream fall to a new market-clearing level? The cold weather wil O A. shift the supply curve to the left, initially creating a surplus until the price falls to where quantity supplied again equals quantity ○ B. cause the supply curve to become fixed, initially creating a surplus until the price falls to where quantity supplied again...
 Using the Supply and Demand Schedules to answer the following questions Table 1 Quantity Quantity Supplied Demand Price 100 30 70 200 40 60 300 50 50 40 400 60 500 70 30 600 80 20 3a. Draw the Supply and Demand graph and label. Show the area for the shortage, surplus, and market equilibrium point demand curve to list inan of ft tw lis determinants of the supply curve to shift outward.
Using the Supply and Demand Schedules to...
Using the Supply and Demand Schedules to answer the following questions Table 1 Quantity Quantity Supplied Demand Price 100 30 70 200 40 60 300 50 50 40 400 60 500 70 30 600 80 20 3a. Draw the Supply and Demand graph and label. Show the area for the shortage, surplus, and market equilibrium point demand curve to list inan of ft tw lis determinants of the supply curve to shift outward.
Using the Supply and Demand Schedules to...
 on 10 of 10 > Consider the supply and demand schedules for calzones at a local pizzeria. Use the information in the schedules to answer the five questions. Demand Price (P) Quantity (Q) $13 S12 S11 SIO 59 $8 $7 56 55 54 20 40 60 80 100 120 140 160 180 20 Supply Price (P) Quantity (0 $4 55 56 57 $8 89 $10 SL $12 $13 20 30 40 50 60 70 80 90 100 110 What is...
 Exhibit 7. Suppose that in a recent market period, the following relationship existed between the price of tablet devices and the quantity supplied and quantity demanded. Price 5330 $340 $350 S360 Quantity Demanded 100 million 90 million 80 milliorn 70 million Quantity Supplied 40 million 60 million 80 million 100 million S370ich 29-Graph the supply and demand curves for tablet devices using the information in the table. What are the equilibrium price and 60 million 120 million quantity? 30- In...
 11-1.The market for pizza has the demand and supply schedules as the table 1.1 Graph (plot) the demand and supply curve by using the information of the demand and supply schedule in the table. Total She t the point,of derhand andsupply at each given price level. Demand and Supply Sehedule 4-4-44-- 104 81 68 53 39 26 pizzas 53 81 98 S6 S8 59 34 121 For ploting demands iag the belowgivn s0 For ploting supplies, drag the below given...
 Suppose that unusually cold weather causes the demand curve for ice cream to shift to the left. Why will the price of ice cream fall to a new market-clearing level? The cold weather wil O A. shift the supply curve to the left, initially creating a surplus until the price falls to where quantity supplied again equals quantity ○ B. cause the supply curve to become fixed, initially creating a surplus until the price falls to where quantity supplied again...
Most questions answered within 3 hours.
-
Blossom Company owns 10000 of the 50000 outstanding shares of
Taylor, Inc. common stock. During 2018,...
asked 39 minutes ago -
Calculate the following: ***SHOW ALL WORK!!!! Or
NO CREDIT*** Circle your answers. 8pts
each
In the...
asked 2 hours ago -
Bank Z is currently advertising interest rates on its checking
account. They claim to pay an...
asked 1 hour ago -
List two ways of transformation on the response variable that
can be used to deal with...
asked 2 hours ago -
If a 2000 ohm resistor has a -3.90 mA current going through it.
What is the...
asked 2 hours ago -
Please comment on the sentences.
Some types of jobs require more training than others. Some
companies...
asked 3 hours ago -
The )G01 for the hydrolysis of phosphorarginine
reaction depicted below is –32 kJ mol-1.
Phosphoarginine ...
asked 4 hours ago -
Cross a heterozygous blue-eyed goat with a homozygous brown-eyed
goat. Be sure to indicate which kids...
asked 5 hours ago -
Use the following information to answer the next two
questions.
Please refer to question 9-90. A...
asked 5 hours ago -
A solution containing 0.050 g of an unknown electrolyte in 2.50
g of cyclohexane was found...
asked 5 hours ago -
Question 1
a) Hydraulic conductivity of soils is an important parameter for
the design of engineering...
asked 5 hours ago -
Suppose your credit card balance is
$15,000
The minimum payment is
$313
and the annual percentage...
asked 5 hours ago