
Homework Answers
Add Answer to:
Listed below are pulse rates (beats per minute) from samples of adult males and females. Does...
Listed below are pulse rates? (beats per? minute) from samples of adult males and females. Does...
Listed below are pulse rates? (beats per? minute) from samples of adult males and females. Does there appear to be a? difference? Find the coefficient of variation for each of the two? samples; then compare the variation. Male 90 71 64 72 72 53 65 52 84 69 64 60 96 54 62 Female 64 83 79 70 74 84 87 85 89 89 92 69 88 80 80 The coefficient of variation for the male pulse is ____ %...
Listed below are pulse rates (beats per minute) from samples of adult males and females. Does there appear to be a difference? Find the coefficient of variation for each of the two samples; then c...
Listed below are pulse rates (beats per minute) from samples of adult males and females. Does there appear to be a difference? Find the coefficient of variation for each of the two samples; then compare the variation. Male 89 70 63 70 71 50 62 53 83 69 62 64 98 56 66 Female 67 82 79 72 72 82 86 85 89 87 93 70 90 80 80
please explain answer Listed below are pulse rates (beats per minute) from samples of adult males...
 please explain answer
Listed below are pulse rates (beats per minute) from samples of adult males and females. Find the mean and median for each of the two samples and then compare the two sets of results. Does there appear to be a difference? Male: 72 61 58 77 81 58 53 70 59 69 52 82 64 59 93 Female: 66 70 90 91 69 62 93 79 88 68 65 92 71 92 87 Find the means The...
please explain answer
Listed below are pulse rates (beats per minute) from samples of adult males and females. Find the mean and median for each of the two samples and then compare the two sets of results. Does there appear to be a difference? Male: 72 61 58 77 81 58 53 70 59 69 52 82 64 59 93 Female: 66 70 90 91 69 62 93 79 88 68 65 92 71 92 87 Find the means The...
Listed below are pulse rates (beats per minute) from samples of adult males and females. Find...
 Listed below are pulse rates (beats per minute) from samples of adult males and females. Find the mean and median for each of the two samples and then compare the two sets of results. Does there appear to be a difference? Male: 67 54 54 86 77 55 62 61 64 57 59 88 63 76 69 Female: 90 79 87 88 68 63 93 87 87 84 66 89 72 89 74 Find the means. The mean for males...
isted below are pulse rates (beats per minute) from samples of adult males and females. Find...
isted below are pulse rates (beats per minute) from samples of adult males and females. Find the mean and median for each of the two samples and then compare the two sets of results. Does there appear to be a difference? Male: 68 59 55 95 72 73 57 88 56 69 57 54 62 55 85 Female: 66 72 87 89 73 68 88 84 95 89 87 91 76 62 88
Use the accompanying data set on the pulse rates (in beats per minute) of males to...
 Use the accompanying data set on the pulse rates (in beats per minute) of males to complete parts (a) and (b) below. Click the icon to view the pulse rates of males. a. Find the mean and standard deviation, and verify that the pulse rates have a distribution that is roughly normal. The mean of the pulse rates is beats per minute. (Round to one decimal place as needed.) 78 85 95 76 50 59 52 58 64 64 51...
Use the accompanying data set on the pulse rates (in beats per minute) of males to...
Use the accompanying data set on the pulse rates (in beats per minute) of males to complete parts (a) and (b) below. LOADING... Click the icon to view the pulse rates of males. a. Find the mean and standard deviation, and verify that the pulse rates have a distribution that is roughly normal. The mean of the pulse rates is 71.871.8 beats per minute. (Round to one decimal place as needed.) The standard deviation of the pulse rates is 12.212.2...
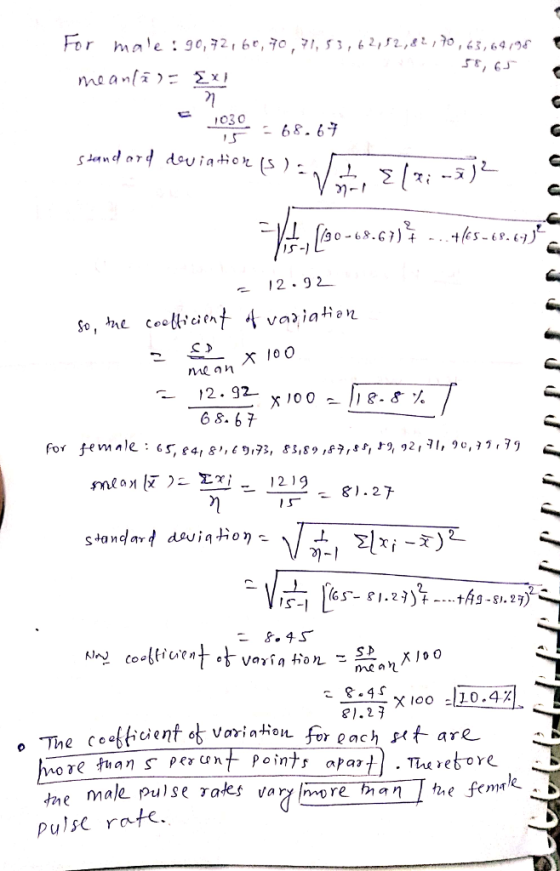
I need help in finding the coefficient of variation for both male and female, please. Show...
 I need help in finding the coefficient of variation for both
male and female, please. Show work please. Thanks.
Homework: Chapters 1, 2 and 3 Save Score: 2.5 of 10 pts 74 of 75 (75 complete)N Score: 95.9%, 719.21 of 750 &3.2.23-T Question Help Listed below are pulse rates (beats per minute) from samples of adult males and females. Does there appear to be a difference? Find the coefficient of variation for each of the two samples, then compare the...
I need help in finding the coefficient of variation for both
male and female, please. Show work please. Thanks.
Homework: Chapters 1, 2 and 3 Save Score: 2.5 of 10 pts 74 of 75 (75 complete)N Score: 95.9%, 719.21 of 750 &3.2.23-T Question Help Listed below are pulse rates (beats per minute) from samples of adult males and females. Does there appear to be a difference? Find the coefficient of variation for each of the two samples, then compare the...
Use the same scales to construct boxplots for the pulse rates of males and females from...
 Use the same scales to construct boxplots for the pulse rates of males and females from the accompanying data sets. Use the boxplots to compare the two data sets m Click the icon to view the data sets - X Determine the boxplot for the men's pulse rate data Pulse rates for men and wome А B. e Men's Pulse Rates 58 72 72 60 60 86 36 75 77 76 Full data set Storio 50 60 70 80 90...
 please explain answer
Listed below are pulse rates (beats per minute) from samples of adult males and females. Find the mean and median for each of the two samples and then compare the two sets of results. Does there appear to be a difference? Male: 72 61 58 77 81 58 53 70 59 69 52 82 64 59 93 Female: 66 70 90 91 69 62 93 79 88 68 65 92 71 92 87 Find the means The...
please explain answer
Listed below are pulse rates (beats per minute) from samples of adult males and females. Find the mean and median for each of the two samples and then compare the two sets of results. Does there appear to be a difference? Male: 72 61 58 77 81 58 53 70 59 69 52 82 64 59 93 Female: 66 70 90 91 69 62 93 79 88 68 65 92 71 92 87 Find the means The...
 Listed below are pulse rates (beats per minute) from samples of adult males and females. Find the mean and median for each of the two samples and then compare the two sets of results. Does there appear to be a difference? Male: 67 54 54 86 77 55 62 61 64 57 59 88 63 76 69 Female: 90 79 87 88 68 63 93 87 87 84 66 89 72 89 74 Find the means. The mean for males...
 Listed below are pulse rates (beats per minute) from samples of adult males and females. Find the mean and median for each of the two samples and then compare the two sets of results. Does there appear to be a difference? Male: 67 54 54 86 77 55 62 61 64 57 59 88 63 76 69 Female: 90 79 87 88 68 63 93 87 87 84 66 89 72 89 74 Find the means. The mean for males...
 Use the accompanying data set on the pulse rates (in beats per minute) of males to complete parts (a) and (b) below. Click the icon to view the pulse rates of males. a. Find the mean and standard deviation, and verify that the pulse rates have a distribution that is roughly normal. The mean of the pulse rates is beats per minute. (Round to one decimal place as needed.) 78 85 95 76 50 59 52 58 64 64 51...
 I need help in finding the coefficient of variation for both
male and female, please. Show work please. Thanks.
Homework: Chapters 1, 2 and 3 Save Score: 2.5 of 10 pts 74 of 75 (75 complete)N Score: 95.9%, 719.21 of 750 &3.2.23-T Question Help Listed below are pulse rates (beats per minute) from samples of adult males and females. Does there appear to be a difference? Find the coefficient of variation for each of the two samples, then compare the...
I need help in finding the coefficient of variation for both
male and female, please. Show work please. Thanks.
Homework: Chapters 1, 2 and 3 Save Score: 2.5 of 10 pts 74 of 75 (75 complete)N Score: 95.9%, 719.21 of 750 &3.2.23-T Question Help Listed below are pulse rates (beats per minute) from samples of adult males and females. Does there appear to be a difference? Find the coefficient of variation for each of the two samples, then compare the...
 Use the same scales to construct boxplots for the pulse rates of males and females from the accompanying data sets. Use the boxplots to compare the two data sets m Click the icon to view the data sets - X Determine the boxplot for the men's pulse rate data Pulse rates for men and wome А B. e Men's Pulse Rates 58 72 72 60 60 86 36 75 77 76 Full data set Storio 50 60 70 80 90...
Most questions answered within 3 hours.
-
The USPS sells money orders identified by an 11 –digit number
x1, x2, …, x11. The...
asked 24 seconds ago -
Provide an example of equilibrium in relation to
Newton’s First and Second Laws. Explain your answer....
asked 1 minute ago -
You are __________ to commit a Type I error using the 0.05 level
of significance than...
asked 19 minutes ago -
1. the following results are obtained:
200
kiwi
575 wild-type
What can we conclude about the...
asked 24 minutes ago -
Explain how you might use E. coli bacteria to produce human
growth hormone using the following:...
asked 25 minutes ago -
WHAT IS THE EFFEKT OF ADD K2CO3 TO ( METHANOL OG WATER)?
asked 39 minutes ago -
Calculate the cell potential, the equilibrium constant, and the
free-energy change for: Ca(s)+Mn2+(aq)(1M)⇌Ca2+(aq)(1M)+Mn(s) given
the following...
asked 37 minutes ago -
Determine the pH at the equivalence (stoichiometric) point in
the titration of 48 mL of 0.28...
asked 37 minutes ago -
11. In CPM/PERT, an activity that is on the critical path
A. has equal values for...
asked 44 minutes ago -
Using C++ :
A Pascals triangle row is constructed by looking at the previous
row and...
asked 1 hour ago -
With what speed will the fastest photoelectrons be emitted from
a surface whose threshold wavelength is...
asked 1 hour ago -
The following slope distances and differences in elevations
between the tape ends were recorded for a...
asked 1 hour ago