

Homework Answers
a) concentration of caffeine = mass of caffeine /Volume added = 0.1293 g/ 0.5mL = 0.2586 g/mL
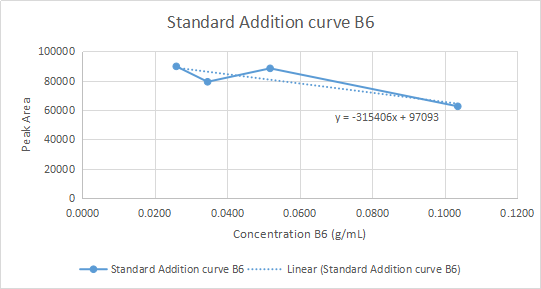
Concentration of Vitamin B6 = mass of Vitamin B6 /Volume added = 0.0518g/ 0.5 mL = 0.1036 g/mL
This can be repeated for all the volumes.
| Caffeine stock volume (mL) | Peak area | Concentration caffeine (g/mL) | B6 stock volume (mL) | peak area | Concentration B6 (g/mL) |
| 0 | 107648 | 0.0000 | 0 | 51785 | 0.0000 |
| 0.5 | 127414 | 0.2586 | 0.5 | 62596 | 0.1036 |
| 1 | 130320 | 0.1293 | 1 | 88509 | 0.0518 |
| 1.5 | 136455 | 0.0862 | 1.5 | 79331 | 0.0345 |
| 2 | 144429 | 0.0647 | 2 | 89862 | 0.0259 |
b)

c)
d)
Concentrations of caffeine and Vitamin B6 can be found out once we know the peak area for them. Using the equations of the graph we can calculate for x.
Caffeine: y =-142377x + 144636
y = 107648 when no stock solution is added.
x = -(107648-144636)/142377 = 0.259 g/mL
Vitamin B6: y = -315406x + 97093
y= 51785 when no stock is added
x = -(51785-97093)/ 315406 = 0.144 g/mL
Add Answer to:
Experiment #4 Data Name of Energy Drink: Red but Mass of Caffeine in Stock Solution: 1293...
The concentration of caffeine in an energy soft drink was determined by standard addition using a...
The concentration of caffeine in an energy soft drink was determined by standard addition using a n emission spectrofluorimeter. The following procedure was used: a standard caffeine solution was prepared by adding 0.6482g of caffeine to 100 cm3 of water. A series of solutions were prepared by adding known volumes of the standard solution to the soft drink before diluting to 100 cm3. The volume of standard and the caffeine peak area are shown in the table Energy Drink (cm3)...
A student prepares a caffeine standard solution that has a concentration of 1858 ppm. To prepare...
A student prepares a caffeine standard solution that has a concentration of 1858 ppm. To prepare a calibration curve, the student pipets various volumes of the standard solution into 50.0 mL volumetric flasks and dilutes to the fill line with water. The absorbance of each solution is measured in a 1.00 cm cuvette using the spectrophotometer and is shown in the table below. Calculate the concentration of each solution and create a calibration curve using the absorbance data provided. Based...
A standard stock solution is diluted to generate three working standard solutions containing ethyl acetate (EA)...
A standard stock solution is diluted to generate three working standard solutions containing ethyl acetate (EA) at 50 ppm, 400 ppm, and 800 ppm. An internal standard, n-butanol (nB), is added so its concentration is 1500 ppm in each of the working standard solutions. The solutions are analyzed using GC-FID. The peak area data for the peak corresponding to ethyl acetate from the standard chromatograms 50 ppm (EA area = 5.05, nB area = 124.37) 400 ppm (EA area =...
Below is data that a researcher collected on the observed decay of a chemical in water...
Below is data that a researcher collected on the observed decay of a chemical in water as a function of time. The Researcher used an analytically technique to quantify the chemical that reports relative “peak area” or “response” values. As a result, the researcher analyzed a series of known “standards” of chemical “A” to construct a standard curve, from which the concentrations of “A” in the experimental samples could be calculated. It is known that the chemical decays by a...
PROCEDURE A. ABSORBANCE SPECTRA 1. Obtain three cuvettes. Add-2mL of the following samples to them: red...
 PROCEDURE A. ABSORBANCE SPECTRA 1. Obtain three cuvettes. Add-2mL of the following samples to them: red dye, blue dye, yellow dye. 2. Obtain a spectrum for each dye according to the provided directions (water is the blank). 3. For each of the three dyes (red, yellow, and blue) record the wavelength for the largest peak in the visible range (380 nm to 750 nm), Record this in the data table below. Save the red dye for part B. 4. Identify...
Experiment # Starting Substrate Concentration Actual Substrate Concentration Substrate Added (ml) Buffer Added (ml) 1.5 mm...
 Experiment # Starting Substrate Concentration Actual Substrate Concentration Substrate Added (ml) Buffer Added (ml) 1.5 mm 1.5 1.0 mm Nm 1.0 0.5 mm 0.50 0.250 mm 0.250 0.125 mm 0.120 1.38 0.060 MM 0.060 1.44 0.030 mm 0.030 1.47 0.015 mm 0.015 1.485 *Actual substrate concentration is calculated by taking the starting substrate concentration into the final volume of each reaction after enzyme has been added. Note that the total volume for each reaction prior to the addition of enzyme...
Determine the equilibrium concentration of FeSCN2+ in each solution. (Page below are the initial concentrations of...
 Determine the equilibrium concentration of FeSCN2+ in each
solution. (Page below are the initial concentrations of FE3+ and
scn- for each solution )
Secondly, use stoichiometry to determine equilibrium FE3+ and
SCN -. ( concentration used for FE and KSCN are both 0.002M )
the absorbance of each standard in the same test tube used to blank the spectrophoto standards from least to most concentrated, rinsing with a small amount of the next sta tilling the test tube. Record absorbance...
Determine the equilibrium concentration of FeSCN2+ in each
solution. (Page below are the initial concentrations of FE3+ and
scn- for each solution )
Secondly, use stoichiometry to determine equilibrium FE3+ and
SCN -. ( concentration used for FE and KSCN are both 0.002M )
the absorbance of each standard in the same test tube used to blank the spectrophoto standards from least to most concentrated, rinsing with a small amount of the next sta tilling the test tube. Record absorbance...
How do I calculate the concentrations for my data sheet lab. I have not started my...
 How do I calculate the concentrations for my data sheet lab. I
have not started my lab yet but I just need to see how i would
calculate it with absorbance. Do i just use Beer's law or is there
any other method of solving the concentrations.
7. Weigh 1.45-1.55 g of copper(I) sulfate pentahydrate in a 50 mL beaker. 8. Dissolve the copper(II) sulfate pentahydrate in -15 mL of water 9. Add the aqueous solution of copper(II) to a...
How do I calculate the concentrations for my data sheet lab. I
have not started my lab yet but I just need to see how i would
calculate it with absorbance. Do i just use Beer's law or is there
any other method of solving the concentrations.
7. Weigh 1.45-1.55 g of copper(I) sulfate pentahydrate in a 50 mL beaker. 8. Dissolve the copper(II) sulfate pentahydrate in -15 mL of water 9. Add the aqueous solution of copper(II) to a...
2) What chemical reaction does the titrant contribute to this experiment? CHEM 1A Experiment #8: Measuring the Vit...
 2)
What chemical reaction does the titrant contribute to this
experiment?
CHEM 1A Experiment #8: Measuring the Vitamin C Content of Emergen-C™ Objectives: Students will learn how to use a burette. Students will learn how to use the iodine starch indicator system to monitor oxidation/reduction reactions. • Students will learn how to conduct a titration to determine the amount of analyte in an unknown solution. • Students will learn about ascorbic acid's role as a biological reducing agent. Introduction: Vitamin...
2)
What chemical reaction does the titrant contribute to this
experiment?
CHEM 1A Experiment #8: Measuring the Vitamin C Content of Emergen-C™ Objectives: Students will learn how to use a burette. Students will learn how to use the iodine starch indicator system to monitor oxidation/reduction reactions. • Students will learn how to conduct a titration to determine the amount of analyte in an unknown solution. • Students will learn about ascorbic acid's role as a biological reducing agent. Introduction: Vitamin...
1) What chemical is the titrant in this experiment? What chemical is the analyte in this experiment? Experi...
 1) What chemical is the titrant in this experiment? What
chemical is the analyte in this
experiment?
Experiment #8: Measuring the Vitamin C Content of Emergen-C™ Objectives: • Students will learn how to use a burette. • Students will learn how to use the iodine starch indicator system to monitor oxidation/reduction reactions. Students will learn how to conduct a titration to determine the amount of analyte in an unknown solution. • Students will learn about ascorbic acid's role as a...
1) What chemical is the titrant in this experiment? What
chemical is the analyte in this
experiment?
Experiment #8: Measuring the Vitamin C Content of Emergen-C™ Objectives: • Students will learn how to use a burette. • Students will learn how to use the iodine starch indicator system to monitor oxidation/reduction reactions. Students will learn how to conduct a titration to determine the amount of analyte in an unknown solution. • Students will learn about ascorbic acid's role as a...
 PROCEDURE A. ABSORBANCE SPECTRA 1. Obtain three cuvettes. Add-2mL of the following samples to them: red dye, blue dye, yellow dye. 2. Obtain a spectrum for each dye according to the provided directions (water is the blank). 3. For each of the three dyes (red, yellow, and blue) record the wavelength for the largest peak in the visible range (380 nm to 750 nm), Record this in the data table below. Save the red dye for part B. 4. Identify...
 Experiment # Starting Substrate Concentration Actual Substrate Concentration Substrate Added (ml) Buffer Added (ml) 1.5 mm 1.5 1.0 mm Nm 1.0 0.5 mm 0.50 0.250 mm 0.250 0.125 mm 0.120 1.38 0.060 MM 0.060 1.44 0.030 mm 0.030 1.47 0.015 mm 0.015 1.485 *Actual substrate concentration is calculated by taking the starting substrate concentration into the final volume of each reaction after enzyme has been added. Note that the total volume for each reaction prior to the addition of enzyme...
 Determine the equilibrium concentration of FeSCN2+ in each
solution. (Page below are the initial concentrations of FE3+ and
scn- for each solution )
Secondly, use stoichiometry to determine equilibrium FE3+ and
SCN -. ( concentration used for FE and KSCN are both 0.002M )
the absorbance of each standard in the same test tube used to blank the spectrophoto standards from least to most concentrated, rinsing with a small amount of the next sta tilling the test tube. Record absorbance...
Determine the equilibrium concentration of FeSCN2+ in each
solution. (Page below are the initial concentrations of FE3+ and
scn- for each solution )
Secondly, use stoichiometry to determine equilibrium FE3+ and
SCN -. ( concentration used for FE and KSCN are both 0.002M )
the absorbance of each standard in the same test tube used to blank the spectrophoto standards from least to most concentrated, rinsing with a small amount of the next sta tilling the test tube. Record absorbance...
 How do I calculate the concentrations for my data sheet lab. I
have not started my lab yet but I just need to see how i would
calculate it with absorbance. Do i just use Beer's law or is there
any other method of solving the concentrations.
7. Weigh 1.45-1.55 g of copper(I) sulfate pentahydrate in a 50 mL beaker. 8. Dissolve the copper(II) sulfate pentahydrate in -15 mL of water 9. Add the aqueous solution of copper(II) to a...
How do I calculate the concentrations for my data sheet lab. I
have not started my lab yet but I just need to see how i would
calculate it with absorbance. Do i just use Beer's law or is there
any other method of solving the concentrations.
7. Weigh 1.45-1.55 g of copper(I) sulfate pentahydrate in a 50 mL beaker. 8. Dissolve the copper(II) sulfate pentahydrate in -15 mL of water 9. Add the aqueous solution of copper(II) to a...
 2)
What chemical reaction does the titrant contribute to this
experiment?
CHEM 1A Experiment #8: Measuring the Vitamin C Content of Emergen-C™ Objectives: Students will learn how to use a burette. Students will learn how to use the iodine starch indicator system to monitor oxidation/reduction reactions. • Students will learn how to conduct a titration to determine the amount of analyte in an unknown solution. • Students will learn about ascorbic acid's role as a biological reducing agent. Introduction: Vitamin...
2)
What chemical reaction does the titrant contribute to this
experiment?
CHEM 1A Experiment #8: Measuring the Vitamin C Content of Emergen-C™ Objectives: Students will learn how to use a burette. Students will learn how to use the iodine starch indicator system to monitor oxidation/reduction reactions. • Students will learn how to conduct a titration to determine the amount of analyte in an unknown solution. • Students will learn about ascorbic acid's role as a biological reducing agent. Introduction: Vitamin...
 1) What chemical is the titrant in this experiment? What
chemical is the analyte in this
experiment?
Experiment #8: Measuring the Vitamin C Content of Emergen-C™ Objectives: • Students will learn how to use a burette. • Students will learn how to use the iodine starch indicator system to monitor oxidation/reduction reactions. Students will learn how to conduct a titration to determine the amount of analyte in an unknown solution. • Students will learn about ascorbic acid's role as a...
1) What chemical is the titrant in this experiment? What
chemical is the analyte in this
experiment?
Experiment #8: Measuring the Vitamin C Content of Emergen-C™ Objectives: • Students will learn how to use a burette. • Students will learn how to use the iodine starch indicator system to monitor oxidation/reduction reactions. Students will learn how to conduct a titration to determine the amount of analyte in an unknown solution. • Students will learn about ascorbic acid's role as a...
Most questions answered within 3 hours.
-
Kylie is a single mom with two dependent children,
Tanner, age 7 and Olivia, age 11....
asked 9 minutes ago -
Phosphorous + bromine = phosphorous tribromide. If 35.0 g of
bromine are reacted and 27.9 grams...
asked 1 hour ago -
Derive the long wavelength limit of the Planck energy density
distribution
asked 1 hour ago -
Calculate the pH of each of the following solutions.
0.50 M HBr
3.1×10⁻⁴ M KOH
4.2×10⁻⁵...
asked 5 hours ago -
For the year ended December 31, Depot Max’s cost of merchandise
sold was $85,600. Inventory at the...
asked 5 hours ago -
Week 10 - Professional Memo Assignment
Professional Memo Assignment
Your mission for this week, should you...
asked 5 hours ago -
Write a Python program that stores the data for each
player on the team, and it...
asked 5 hours ago -
In
the last 3 months, mike never knows when he is going to get his
allowance...
asked 5 hours ago -
Is Ca(OH)2 a Bronsted base, Lewis base, or both? Why?
asked 5 hours ago -
1A- Why don’t voters complain about U.S. tariffs on imported
sugar?
Because sugar is only a...
asked 5 hours ago -
Cash Payback Period
Primera Banco is evaluating two capital investment proposals for
a drive-up ATM kiosk,...
asked 5 hours ago -
Create a button in Swift (Xcode) that will create a charge,
create a charge using Stripe's...
asked 5 hours ago