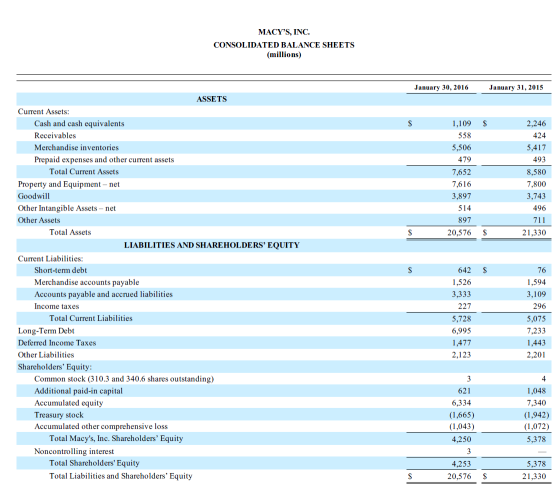
I was provided both the Balance Sheet and Statement of income from which I am supposed to calculate the inventory turnover ratio. But the balance sheet only has the inventory values for 2016 and 2015, while the statement of income only states the cost of sales for 2015, 2014, and 2013.
So:
Merchandise inventory (from balance sheet):
January 30, 2016 = $5,506
January 31, 2015 = $5,417
Cost of Sales (from income statement):
2015 = $16,496
2014 = $16,863
2013 = $16,725
Usually the turnover ratio would, for example, be: (2016 cost of sales)/(average of 2016 inventory and 2015 inventory)
But the cost of sales for 2016 isnt provided, and if I were to use cost of sales for 2015, the 2014 inventory isn't provided.

Homework Answers
Answer:
Financial year of Macy's Inc. may be from Jan 31 to Jan 30 next year.
Hence Income statement for 2015 means income statement for period from Jan 31, 2015 to Jan 30, 2016.
The beginning and ending inventory values for this period are also given.
As such you can calculate inventory turnover ratio for 2015 by using cost of sales for 2015 (from Jan 31, 2015 to Jan 30, 2016) and beginning inventory as of Jan 31,2015 of $5,417 and ending inventory as of January 30, 2016 of $5,506
Hence:
Inventory Turnover ration for 2015 = 16496 / ((5417 + 5506) / 2) = 3.02
Add Answer to:
I was provided both the Balance Sheet and Statement of income
from which I am supposed...
What is the inventory turnover rate of this company? January 30, 2016 January 31, 2015 $...
 What is the inventory turnover rate of this company?
January 30, 2016 January 31, 2015 $ $ 2,246 424 1,109 558 5,506 479 7,652 7,616 3,897 514 897 20,576 5,417 493 8.580 7.800 3,743 496 711 21,330 $ $ S ASSETS Current Assets Cash and cash equivalents Receivables Merchandise inventories Prepaid expenses and other current assets Total Current Assets Property and Equipment - net Goodwill Other Intangible Assets-net Other Assets Total Assets LIABILITIES AND SHAREHOLDERS' EQUITY Current Liabilities: Short-term debt...
What is the inventory turnover rate of this company?
January 30, 2016 January 31, 2015 $ $ 2,246 424 1,109 558 5,506 479 7,652 7,616 3,897 514 897 20,576 5,417 493 8.580 7.800 3,743 496 711 21,330 $ $ S ASSETS Current Assets Cash and cash equivalents Receivables Merchandise inventories Prepaid expenses and other current assets Total Current Assets Property and Equipment - net Goodwill Other Intangible Assets-net Other Assets Total Assets LIABILITIES AND SHAREHOLDERS' EQUITY Current Liabilities: Short-term debt...
h. Days of inventory. 1. Inventory turnover ratio. J. Average collection period Based on these ratios,...
 h. Days of inventory. 1. Inventory turnover ratio. J. Average collection period Based on these ratios, did Macy's financial performance improve, weaken, or remain about the same from 2015 to 2016? (479) 198 Consolidated Statements of Income for Macy's, Inc., 2015-2016 (in millions, except per share amounts) 2016 2015 Net sales $25,778 $27,079 Cost of sales (15,621) (16,496 Gross margin 10,157 10,583 Selling, general and administrative expenses (8,265) (8,256) Impairments, store closing and other costs (288) Settlement charges Operating income...
answer is presented.1234 it will be marked incorrect.) 2018 2017 2016 2015 Sales Cost of Goods Sold Gross Income Op...
 answer is presented.1234 it will be marked incorrect.) 2018 2017 2016 2015 Sales Cost of Goods Sold Gross Income Operating Expenses Operating Income Interest Expense $29,778 $27,079 $28,105 $27,931 16,496 $12,157 $10,583 $11,242| S11,206 8,544 $2,039 361 17,621 16,863 16,725 8,459 8,942 $3,215 8,528 $2,678 388 $2,783 393 864 383 Taxes 921 608 1,070 804 Net Income S1,911 $1,526 $1,486 $1,109 $2,273 Cash $2,246 424 5,910 S8,580 $21,851 $20,576 $21,330 $21,620 $5,075 $15,528 $16,326 $15,952 S15,371 $5,378 $2,297 522 Receivables...
ASSURANCE OF LEARNING EXERCISES 1. conn LO4-1 Using the financial ratios provided in the Appendix and...
 ASSURANCE OF LEARNING EXERCISES 1. conn LO4-1 Using the financial ratios provided in the Appendix and the following financial statement information for Macy's, Inc., calculate the following ratios for Macy's for both 2015 and 2016. 1. Gross profit margin 2. Operating profit margin 3. Net profit margin 4. Times interest earned coverage 5. Return on shareholders' equity 6. Return on assets 7. Long-term debt-to-equity ratio 8. Days of inventory 9. Inventory turnover ratio 10. Average collection period Based on these...
Ratios 2016 2015 a. Gross profit margin (%) 39.4 39.1 b. Operating profit margin (%) 5.1...
 Ratios
2016
2015
a.
Gross profit margin (%)
39.4
39.1
b.
Operating profit margin (%)
5.1
7.5
c.
Net profit margin (%)
2.4
4.0
d.
Return on shareholders' equity (%)
14.1
25.2
e.
Return on assets (%)
3.1
5.2
f.
Times interest earned coverage
3.6
5.6
g.
Long-term debt-to-equity ratio
1.5
3.8
h.
Days of inventory
126.2
121.8
i.
Inventory turnover ratio
2.9
3.0
j.
Average collection
period
7.4
7.5
1-From 2015 to 2016, Macy’s, Inc., return on equity and...
Ratios
2016
2015
a.
Gross profit margin (%)
39.4
39.1
b.
Operating profit margin (%)
5.1
7.5
c.
Net profit margin (%)
2.4
4.0
d.
Return on shareholders' equity (%)
14.1
25.2
e.
Return on assets (%)
3.1
5.2
f.
Times interest earned coverage
3.6
5.6
g.
Long-term debt-to-equity ratio
1.5
3.8
h.
Days of inventory
126.2
121.8
i.
Inventory turnover ratio
2.9
3.0
j.
Average collection
period
7.4
7.5
1-From 2015 to 2016, Macy’s, Inc., return on equity and...
please show all work. LO1, 2, 3 MACY'S INC. M3-26. Compute and Interpret Disaggregation of DuPont...
 please show all work.
LO1, 2, 3 MACY'S INC. M3-26. Compute and Interpret Disaggregation of DuPont Analysis Ratios Selected balance sheet and income statement information for Macy's Inc., a retailer, follows. 2015 2015 2015 2014 Company ($ millions) Ticker Sales Net Income Assets Assets Macy's............. M $27,079 $1,072 $20,576 $21,330 $4,250 $5,378 2015 2014 Stockholders' Stockholders' Equity Equity a.Compute Macy's 2015 return on equity (ROE). b.Disaggregate ROE into profit margin, asset turnover, and financial leverage. Confirm that ROE = PM...
please show all work.
LO1, 2, 3 MACY'S INC. M3-26. Compute and Interpret Disaggregation of DuPont Analysis Ratios Selected balance sheet and income statement information for Macy's Inc., a retailer, follows. 2015 2015 2015 2014 Company ($ millions) Ticker Sales Net Income Assets Assets Macy's............. M $27,079 $1,072 $20,576 $21,330 $4,250 $5,378 2015 2014 Stockholders' Stockholders' Equity Equity a.Compute Macy's 2015 return on equity (ROE). b.Disaggregate ROE into profit margin, asset turnover, and financial leverage. Confirm that ROE = PM...
success. It involves using the results of both industry and competitive analysis and com pany situation...
 success. It involves using the results of both industry and competitive analysis and com pany situation analysis to identify a "worry list" of issues to be resolved for the company to be financially and competitively successful in the years ahead. Actually deciding upon a strategy and what specific actions to take comes after the list of strategic issues and prob- lems that merit front-burner management attention has been developed. Good company situation analysis, like good industry and competitive analysis, is...
Pro forma Income Statement & Balance Sheet for Radial Inc. This exper...
Pro forma Income Statement & Balance Sheet for Radial Inc. This experiential exercise involves creating a pro forma Balance Sheet and a pro forma Income Statement for Radial Inc. Assume the current year is 2015. To assist you in this endeavor, an Excel worksheet containing Radial's 2014 Income Statement and Balance Sheet has been provided. Develop the two pro forma financial statements for 2015 based upon the following assumptions: The company plans to increase sales by an additional 2 percent...
I need help filling in the green spaces for both the Income Statement and Balance Sheet....
 I need help filling in the green spaces for both the Income
Statement and Balance Sheet. Below is Exhibit 1 (Financial and
Operating Data for Cosco).
TIP: use n = 3 for the CAGR calculation.
Please explain using an Excel spreadsheet,
formulas, and a step-by-step analysis/explanation.
Any
help would be appreciated!
EXHIBIT 1
Please use these financial ratio equations:
Liquity Ratios:
544 53 EXHIBIT 1 Selected Financial and Operating Data for Costco Wholesale Corp., Fiscal Years 2000, 2005, 2011, and...
I need help filling in the green spaces for both the Income
Statement and Balance Sheet. Below is Exhibit 1 (Financial and
Operating Data for Cosco).
TIP: use n = 3 for the CAGR calculation.
Please explain using an Excel spreadsheet,
formulas, and a step-by-step analysis/explanation.
Any
help would be appreciated!
EXHIBIT 1
Please use these financial ratio equations:
Liquity Ratios:
544 53 EXHIBIT 1 Selected Financial and Operating Data for Costco Wholesale Corp., Fiscal Years 2000, 2005, 2011, and...
please do Waterloo Corporation Statement of Financial Position 31-Dec 2015 2014 2013 Assets Cash $32,000 $19,000...
 please do
Waterloo Corporation Statement of Financial Position 31-Dec 2015 2014 2013 Assets Cash $32,000 $19,000 $10,000 Accounts Receivable (net) 95,000 70,000 53,000 Inventory 81,000 71,000 53,000 Other current assets 65,000 49,000 61,000 Long-term investments 120,000 76,000 50,000 Property, Plant & Equipment (net) 598,000 345,000 315.000 Total Assets $991,000 $630,000 $542,000 $71,500 245.000 316,500 $56,000 75.000 131,000 $65,000 78,000 143,000 Liabilities & Shareholders' Equity Liabilities Current Liabilities Non-current liabilities Total Liabilities Shareholders' Equity Common Shares Retained Earnings Total Shareholders' Equity...
please do
Waterloo Corporation Statement of Financial Position 31-Dec 2015 2014 2013 Assets Cash $32,000 $19,000 $10,000 Accounts Receivable (net) 95,000 70,000 53,000 Inventory 81,000 71,000 53,000 Other current assets 65,000 49,000 61,000 Long-term investments 120,000 76,000 50,000 Property, Plant & Equipment (net) 598,000 345,000 315.000 Total Assets $991,000 $630,000 $542,000 $71,500 245.000 316,500 $56,000 75.000 131,000 $65,000 78,000 143,000 Liabilities & Shareholders' Equity Liabilities Current Liabilities Non-current liabilities Total Liabilities Shareholders' Equity Common Shares Retained Earnings Total Shareholders' Equity...
 What is the inventory turnover rate of this company?
January 30, 2016 January 31, 2015 $ $ 2,246 424 1,109 558 5,506 479 7,652 7,616 3,897 514 897 20,576 5,417 493 8.580 7.800 3,743 496 711 21,330 $ $ S ASSETS Current Assets Cash and cash equivalents Receivables Merchandise inventories Prepaid expenses and other current assets Total Current Assets Property and Equipment - net Goodwill Other Intangible Assets-net Other Assets Total Assets LIABILITIES AND SHAREHOLDERS' EQUITY Current Liabilities: Short-term debt...
What is the inventory turnover rate of this company?
January 30, 2016 January 31, 2015 $ $ 2,246 424 1,109 558 5,506 479 7,652 7,616 3,897 514 897 20,576 5,417 493 8.580 7.800 3,743 496 711 21,330 $ $ S ASSETS Current Assets Cash and cash equivalents Receivables Merchandise inventories Prepaid expenses and other current assets Total Current Assets Property and Equipment - net Goodwill Other Intangible Assets-net Other Assets Total Assets LIABILITIES AND SHAREHOLDERS' EQUITY Current Liabilities: Short-term debt...
 h. Days of inventory. 1. Inventory turnover ratio. J. Average collection period Based on these ratios, did Macy's financial performance improve, weaken, or remain about the same from 2015 to 2016? (479) 198 Consolidated Statements of Income for Macy's, Inc., 2015-2016 (in millions, except per share amounts) 2016 2015 Net sales $25,778 $27,079 Cost of sales (15,621) (16,496 Gross margin 10,157 10,583 Selling, general and administrative expenses (8,265) (8,256) Impairments, store closing and other costs (288) Settlement charges Operating income...
 answer is presented.1234 it will be marked incorrect.) 2018 2017 2016 2015 Sales Cost of Goods Sold Gross Income Operating Expenses Operating Income Interest Expense $29,778 $27,079 $28,105 $27,931 16,496 $12,157 $10,583 $11,242| S11,206 8,544 $2,039 361 17,621 16,863 16,725 8,459 8,942 $3,215 8,528 $2,678 388 $2,783 393 864 383 Taxes 921 608 1,070 804 Net Income S1,911 $1,526 $1,486 $1,109 $2,273 Cash $2,246 424 5,910 S8,580 $21,851 $20,576 $21,330 $21,620 $5,075 $15,528 $16,326 $15,952 S15,371 $5,378 $2,297 522 Receivables...
 ASSURANCE OF LEARNING EXERCISES 1. conn LO4-1 Using the financial ratios provided in the Appendix and the following financial statement information for Macy's, Inc., calculate the following ratios for Macy's for both 2015 and 2016. 1. Gross profit margin 2. Operating profit margin 3. Net profit margin 4. Times interest earned coverage 5. Return on shareholders' equity 6. Return on assets 7. Long-term debt-to-equity ratio 8. Days of inventory 9. Inventory turnover ratio 10. Average collection period Based on these...
 Ratios
2016
2015
a.
Gross profit margin (%)
39.4
39.1
b.
Operating profit margin (%)
5.1
7.5
c.
Net profit margin (%)
2.4
4.0
d.
Return on shareholders' equity (%)
14.1
25.2
e.
Return on assets (%)
3.1
5.2
f.
Times interest earned coverage
3.6
5.6
g.
Long-term debt-to-equity ratio
1.5
3.8
h.
Days of inventory
126.2
121.8
i.
Inventory turnover ratio
2.9
3.0
j.
Average collection
period
7.4
7.5
1-From 2015 to 2016, Macy’s, Inc., return on equity and...
Ratios
2016
2015
a.
Gross profit margin (%)
39.4
39.1
b.
Operating profit margin (%)
5.1
7.5
c.
Net profit margin (%)
2.4
4.0
d.
Return on shareholders' equity (%)
14.1
25.2
e.
Return on assets (%)
3.1
5.2
f.
Times interest earned coverage
3.6
5.6
g.
Long-term debt-to-equity ratio
1.5
3.8
h.
Days of inventory
126.2
121.8
i.
Inventory turnover ratio
2.9
3.0
j.
Average collection
period
7.4
7.5
1-From 2015 to 2016, Macy’s, Inc., return on equity and...
 please show all work.
LO1, 2, 3 MACY'S INC. M3-26. Compute and Interpret Disaggregation of DuPont Analysis Ratios Selected balance sheet and income statement information for Macy's Inc., a retailer, follows. 2015 2015 2015 2014 Company ($ millions) Ticker Sales Net Income Assets Assets Macy's............. M $27,079 $1,072 $20,576 $21,330 $4,250 $5,378 2015 2014 Stockholders' Stockholders' Equity Equity a.Compute Macy's 2015 return on equity (ROE). b.Disaggregate ROE into profit margin, asset turnover, and financial leverage. Confirm that ROE = PM...
please show all work.
LO1, 2, 3 MACY'S INC. M3-26. Compute and Interpret Disaggregation of DuPont Analysis Ratios Selected balance sheet and income statement information for Macy's Inc., a retailer, follows. 2015 2015 2015 2014 Company ($ millions) Ticker Sales Net Income Assets Assets Macy's............. M $27,079 $1,072 $20,576 $21,330 $4,250 $5,378 2015 2014 Stockholders' Stockholders' Equity Equity a.Compute Macy's 2015 return on equity (ROE). b.Disaggregate ROE into profit margin, asset turnover, and financial leverage. Confirm that ROE = PM...
 success. It involves using the results of both industry and competitive analysis and com pany situation analysis to identify a "worry list" of issues to be resolved for the company to be financially and competitively successful in the years ahead. Actually deciding upon a strategy and what specific actions to take comes after the list of strategic issues and prob- lems that merit front-burner management attention has been developed. Good company situation analysis, like good industry and competitive analysis, is...
 I need help filling in the green spaces for both the Income
Statement and Balance Sheet. Below is Exhibit 1 (Financial and
Operating Data for Cosco).
TIP: use n = 3 for the CAGR calculation.
Please explain using an Excel spreadsheet,
formulas, and a step-by-step analysis/explanation.
Any
help would be appreciated!
EXHIBIT 1
Please use these financial ratio equations:
Liquity Ratios:
544 53 EXHIBIT 1 Selected Financial and Operating Data for Costco Wholesale Corp., Fiscal Years 2000, 2005, 2011, and...
I need help filling in the green spaces for both the Income
Statement and Balance Sheet. Below is Exhibit 1 (Financial and
Operating Data for Cosco).
TIP: use n = 3 for the CAGR calculation.
Please explain using an Excel spreadsheet,
formulas, and a step-by-step analysis/explanation.
Any
help would be appreciated!
EXHIBIT 1
Please use these financial ratio equations:
Liquity Ratios:
544 53 EXHIBIT 1 Selected Financial and Operating Data for Costco Wholesale Corp., Fiscal Years 2000, 2005, 2011, and...
 please do
Waterloo Corporation Statement of Financial Position 31-Dec 2015 2014 2013 Assets Cash $32,000 $19,000 $10,000 Accounts Receivable (net) 95,000 70,000 53,000 Inventory 81,000 71,000 53,000 Other current assets 65,000 49,000 61,000 Long-term investments 120,000 76,000 50,000 Property, Plant & Equipment (net) 598,000 345,000 315.000 Total Assets $991,000 $630,000 $542,000 $71,500 245.000 316,500 $56,000 75.000 131,000 $65,000 78,000 143,000 Liabilities & Shareholders' Equity Liabilities Current Liabilities Non-current liabilities Total Liabilities Shareholders' Equity Common Shares Retained Earnings Total Shareholders' Equity...
please do
Waterloo Corporation Statement of Financial Position 31-Dec 2015 2014 2013 Assets Cash $32,000 $19,000 $10,000 Accounts Receivable (net) 95,000 70,000 53,000 Inventory 81,000 71,000 53,000 Other current assets 65,000 49,000 61,000 Long-term investments 120,000 76,000 50,000 Property, Plant & Equipment (net) 598,000 345,000 315.000 Total Assets $991,000 $630,000 $542,000 $71,500 245.000 316,500 $56,000 75.000 131,000 $65,000 78,000 143,000 Liabilities & Shareholders' Equity Liabilities Current Liabilities Non-current liabilities Total Liabilities Shareholders' Equity Common Shares Retained Earnings Total Shareholders' Equity...
Most questions answered within 3 hours.
-
3) What are the typical social structures in a global city?
asked 1 hour ago -
Luther Corporation
Consolidated Balance Sheet
December 31, 2019 and 2018 (in $ millions)
Assets
2019
2018...
asked 1 hour ago -
(Expected rate of return and risk) Carter Inc. is evaluating a
security. Calculate the investment’s expected...
asked 3 hours ago -
What specific indicators can point to lack of progress for
African Americans in American society?
asked 4 hours ago -
1-The Electrons in a beam are moving at 2.7×10⁸ m/s in an
electric field of 15000...
asked 5 hours ago -
A gas tank is a vertical cylinder. It has a radius of 1m, a
height of...
asked 5 hours ago -
Accent Software faces the following conditions. All of these
support Accent’s use of a market-penetration pricing...
asked 6 hours ago -
A mathematically inclined friend emails you the following
instructions: "Meet me in the cafeteria the first...
asked 6 hours ago -
A monopoly sells in two countries . The demand curves in the two
countries are p1...
asked 7 hours ago -
A .15kg rubber ball is bounced off a wall. Before hitting the
wall, the ball moves...
asked 8 hours ago -
A manufacturing company preparing to build a new plant is
considering three potential locations for it....
asked 8 hours ago -
B. If compound Y has approximately the same values of solubility
in toluene as compound X,...
asked 9 hours ago