
Homework Answers

Add Answer to:
Need to show work
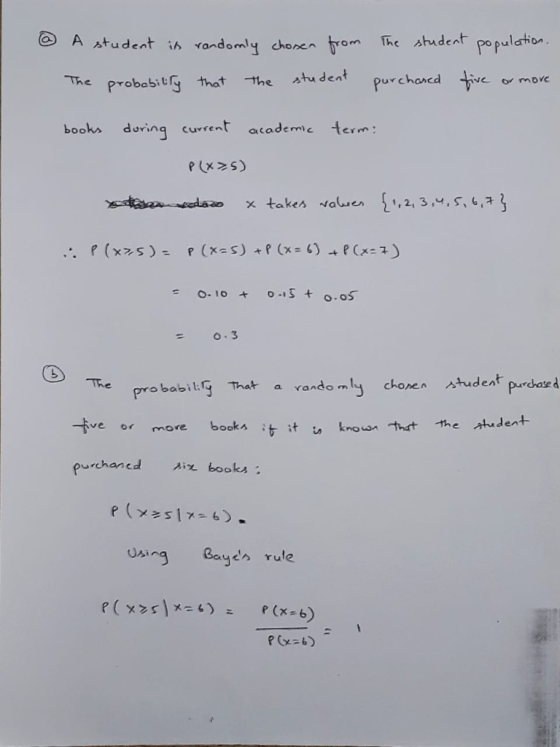
10. Let X -number of books purchased by students at your school...
A tidal wave or tsunami is usually the result of an earthquake in the Pacific Rim,...
 A tidal wave or tsunami is usually the result of an earthquake in the Pacific Rim, often 1000 or more miles from Hawaii. Tsunamis are rare but dangerous. Many tsunamis are small and do little damage. However, a tsunami nine meters or higher is very dangerous Civil Defense authorities sound an alarm telling people near the beach to go to higher ground. About 30% of all recorded tsunamis have been nne meters or higher t You are writing a report...
Have to show work for every problem 4. A company uses three plants to produce a...
 Have to show work for every problem
4. A company uses three plants to produce a new computer chip. Plant A produces 30% of the chips. Plant B produces 45% of the chips. The rest of the chips are produced by plant C. Each plant has its own defectiv rate. These are: plant A produces 3% defective chips, plant B produces 1% defective chips, plant C produces 5% defective chips. Hint: draw a tree diagram. (a) Construct a tree diagram...
Have to show work for every problem
4. A company uses three plants to produce a new computer chip. Plant A produces 30% of the chips. Plant B produces 45% of the chips. The rest of the chips are produced by plant C. Each plant has its own defectiv rate. These are: plant A produces 3% defective chips, plant B produces 1% defective chips, plant C produces 5% defective chips. Hint: draw a tree diagram. (a) Construct a tree diagram...
X = number of books Probability 1 0.05 2 0.10 3 0.20 4 0.35 5 0.10...
 X = number of books Probability 1 0.05 2 0.10 3 0.20 4 0.35 5 0.10 6 0.15 7 0.05 13. For this problem, look at the "number of books" problem above. (a) Compute the expected value of X and interpret its meaning. Answer: E(X) = 4 (b) How many books are expected to be purchased if the enrollment is 20,000 students? Answer: Expected number of books = 4.20,000 = 80,000 (4.2.1)
Suppose Microeconomic Principles and Macroeconomic Principles both have two recommended text- books. The bivariate distribution of...
 Suppose Microeconomic Principles and Macroeconomic Principles both have two recommended text- books. The bivariate distribution of the number of micro and macro textbooks actually purchased by economics students is: Micro, X Macro, Y X=0 X=1 X = 2 Y = 0 0.15 0.15 0.05 Y =1 0 .15 0.10 0.05 Y = 200.050.30 à. Find the marginal distributions for the number of micro and macro textbooks purchased for each student b. Compute E(X). E(Y), Var(X), Var(Y), and Cov(X,Y). c. Compute...
Need to show work 9. The distribution of grades in the Physical Science Department at a...
 Need to show work
9. The distribution of grades in the Physical Science Department at a large university is given in the following table. Grades are represented by numerical values according to the scale. A-4, B Grade Probability 0.10 0.12 0.35 0.30 (a) Define an appropriate random variable and its range. (b) what percent of the grades are A's? Answer: 13% (c) What is the probability that a randomly chosen student taking a class in the Physical Science Department will...
Need to show work
9. The distribution of grades in the Physical Science Department at a large university is given in the following table. Grades are represented by numerical values according to the scale. A-4, B Grade Probability 0.10 0.12 0.35 0.30 (a) Define an appropriate random variable and its range. (b) what percent of the grades are A's? Answer: 13% (c) What is the probability that a randomly chosen student taking a class in the Physical Science Department will...
On a randomly chosen day , let X be the number of attacks of Snow Miser...
On a randomly chosen day , let X be the number of attacks of Snow Miser against Heat Miser, and let Y represent the number of attacks of Heat Miser against Snow Miser. Y=0 5 8 Total X=4 0.20 0.05 0.10 0.35 6 0.25 0.10 0.30 0.65 Total 0.45 0.15 0.40 1.0 a) Find the probability that on a randomly selected day, Snow Miser initiates more attacks than Heat Miser. b) Find PX(x) and PY(y). c) Are X and...
Let X denote the number of times a photocopy machine will malfunction: 0,1,2, or 3 times,...
 Let X denote the number of times a photocopy machine will malfunction: 0,1,2, or 3 times, on any given month. Let Y denote the number of times a technician is called onan emergency call. The joint p.m.f. p(x,y) is presented in the table below: y\. 0 1 2 3 0 0.15 0.30 0.05 0 1 0.05 0.15 0.05 0.05 2 0 0.05 0.10 0.05 Px(2) 0.20 0.50 0.20 0.10 py(y) 0.50 0.30 0.20 1.00 (a) Find the probability distribution of...
10. Let X denote the number of times a certain numerical control machine will malfunction: 1,...
 10. Let X denote the number of times a certain numerical control machine will malfunction: 1, 2, or 3 times on any given day. Let Y denote the number of times a technician is called on an emergency call. Their joint probability distribution is given as 0.05 0.10 0.20 Evaluate the marginal distribution of X. flx, y) 1 1 0.05 y 3 0.05 5 0.00 0.10 0.35 0.10 a. b. Evaluate the marginal distribution of Y c. Find eXY-3/X -2)....
Please explain and show all work 3· Le t x represent the number of credit cards...
 Please explain and show all work
3· Le t x represent the number of credit cards a student has. A random sample of 100 students at a large university was taken and the results are in the table below: Credit NumberRelative xStudentsPr) 12 P(x) Cards of Frequencyx .P(x) 45 25 10 TOTAL 100 1.00 a) Construct a probability distribution histogram and comment on its shape b) What is the probability a randomly selected student has at least two credit cards?...
Please explain and show all work
3· Le t x represent the number of credit cards a student has. A random sample of 100 students at a large university was taken and the results are in the table below: Credit NumberRelative xStudentsPr) 12 P(x) Cards of Frequencyx .P(x) 45 25 10 TOTAL 100 1.00 a) Construct a probability distribution histogram and comment on its shape b) What is the probability a randomly selected student has at least two credit cards?...
 A tidal wave or tsunami is usually the result of an earthquake in the Pacific Rim, often 1000 or more miles from Hawaii. Tsunamis are rare but dangerous. Many tsunamis are small and do little damage. However, a tsunami nine meters or higher is very dangerous Civil Defense authorities sound an alarm telling people near the beach to go to higher ground. About 30% of all recorded tsunamis have been nne meters or higher t You are writing a report...
 Have to show work for every problem
4. A company uses three plants to produce a new computer chip. Plant A produces 30% of the chips. Plant B produces 45% of the chips. The rest of the chips are produced by plant C. Each plant has its own defectiv rate. These are: plant A produces 3% defective chips, plant B produces 1% defective chips, plant C produces 5% defective chips. Hint: draw a tree diagram. (a) Construct a tree diagram...
Have to show work for every problem
4. A company uses three plants to produce a new computer chip. Plant A produces 30% of the chips. Plant B produces 45% of the chips. The rest of the chips are produced by plant C. Each plant has its own defectiv rate. These are: plant A produces 3% defective chips, plant B produces 1% defective chips, plant C produces 5% defective chips. Hint: draw a tree diagram. (a) Construct a tree diagram...
 X = number of books Probability 1 0.05 2 0.10 3 0.20 4 0.35 5 0.10 6 0.15 7 0.05 13. For this problem, look at the "number of books" problem above. (a) Compute the expected value of X and interpret its meaning. Answer: E(X) = 4 (b) How many books are expected to be purchased if the enrollment is 20,000 students? Answer: Expected number of books = 4.20,000 = 80,000 (4.2.1)
 Suppose Microeconomic Principles and Macroeconomic Principles both have two recommended text- books. The bivariate distribution of the number of micro and macro textbooks actually purchased by economics students is: Micro, X Macro, Y X=0 X=1 X = 2 Y = 0 0.15 0.15 0.05 Y =1 0 .15 0.10 0.05 Y = 200.050.30 à. Find the marginal distributions for the number of micro and macro textbooks purchased for each student b. Compute E(X). E(Y), Var(X), Var(Y), and Cov(X,Y). c. Compute...
 Need to show work
9. The distribution of grades in the Physical Science Department at a large university is given in the following table. Grades are represented by numerical values according to the scale. A-4, B Grade Probability 0.10 0.12 0.35 0.30 (a) Define an appropriate random variable and its range. (b) what percent of the grades are A's? Answer: 13% (c) What is the probability that a randomly chosen student taking a class in the Physical Science Department will...
Need to show work
9. The distribution of grades in the Physical Science Department at a large university is given in the following table. Grades are represented by numerical values according to the scale. A-4, B Grade Probability 0.10 0.12 0.35 0.30 (a) Define an appropriate random variable and its range. (b) what percent of the grades are A's? Answer: 13% (c) What is the probability that a randomly chosen student taking a class in the Physical Science Department will...
 Let X denote the number of times a photocopy machine will malfunction: 0,1,2, or 3 times, on any given month. Let Y denote the number of times a technician is called onan emergency call. The joint p.m.f. p(x,y) is presented in the table below: y\. 0 1 2 3 0 0.15 0.30 0.05 0 1 0.05 0.15 0.05 0.05 2 0 0.05 0.10 0.05 Px(2) 0.20 0.50 0.20 0.10 py(y) 0.50 0.30 0.20 1.00 (a) Find the probability distribution of...
 10. Let X denote the number of times a certain numerical control machine will malfunction: 1, 2, or 3 times on any given day. Let Y denote the number of times a technician is called on an emergency call. Their joint probability distribution is given as 0.05 0.10 0.20 Evaluate the marginal distribution of X. flx, y) 1 1 0.05 y 3 0.05 5 0.00 0.10 0.35 0.10 a. b. Evaluate the marginal distribution of Y c. Find eXY-3/X -2)....
 Please explain and show all work
3· Le t x represent the number of credit cards a student has. A random sample of 100 students at a large university was taken and the results are in the table below: Credit NumberRelative xStudentsPr) 12 P(x) Cards of Frequencyx .P(x) 45 25 10 TOTAL 100 1.00 a) Construct a probability distribution histogram and comment on its shape b) What is the probability a randomly selected student has at least two credit cards?...
Please explain and show all work
3· Le t x represent the number of credit cards a student has. A random sample of 100 students at a large university was taken and the results are in the table below: Credit NumberRelative xStudentsPr) 12 P(x) Cards of Frequencyx .P(x) 45 25 10 TOTAL 100 1.00 a) Construct a probability distribution histogram and comment on its shape b) What is the probability a randomly selected student has at least two credit cards?...
Most questions answered within 3 hours.
-
You have a yeast cell culture with a concentration of 5x10^4
cells/ml. If you dilute this...
asked 37 seconds from now -
In which direction the Reaction goes? Show detailed process.
SeO3 + 2ClO2. + 2H3O <---> Se...
asked 12 minutes ago -
Unexposed silver halides are removed from photographic film when
they react with sodium thiosulfate
(Na2S2O3, called...
asked 13 minutes ago -
A 0.3054 gram sample of the mineral chalcopyrite (CuFeS2)
yielded 0.6525 gram BaSO4 precipitate. What is...
asked 13 minutes ago -
An short-seller in Tesla is worried the latest management
earnings forecast is too aggressive and the...
asked 59 minutes ago -
Question 3 (1 point)
Fill in the blank. Speed Car Rental company found that the tire...
asked 59 minutes ago -
1. A copper wire is 26.61 cm long and weighs 1.265 g. The
density of copper...
asked 37 minutes ago -
Remember that a concept sketch consists of a sketch (or
series of sketches), labels, and complete...
asked 39 minutes ago -
on a newly discovered planet, the period of a pendulum with a
length of 2 m...
asked 41 minutes ago -
Why [M(CN)6] is not organometallic even it has metal
to carbon bond too
asked 47 minutes ago -
mstar electric has a bond issue outstanding that has a 20 year
life, a $1,000 par...
asked 55 minutes ago -
This is a Business Writing Question:
Common Types of Faulty Sentence Logic:
A. Mixed constructions
B....
asked 56 minutes ago