
Homework Answers
Requirement a: Estimate cost formula using the high-low method as follows
Variable cost = Change in cost ÷ Change in activity
= ($1,500 − $1,100) (130 packages – 90 packages)
= $10 per package
Fixed Cost = Total cost − (Variable cost per unit × Number of packages)
= $1,500 – ($10 × 130)
= $200
Cost formula: y = $10x + $200 where y is total cost and x is number of packages
Shipping cost in July when number of packages shipped is 150
Shipping cost = ($10 × Number of packages) + $200
= ($10 × $150) + $200
= $1,700
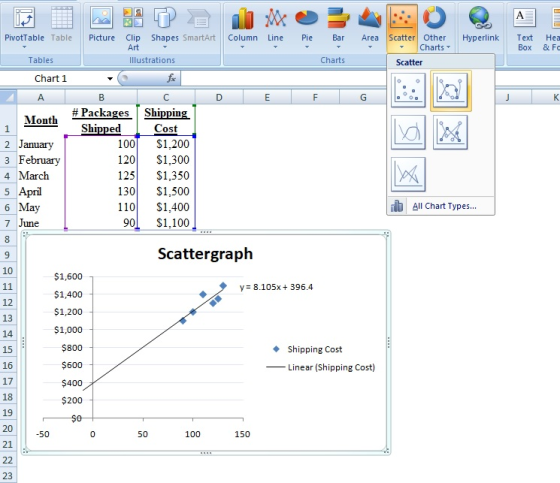
Requirement b. Using the scatter graph method, estimate the cost formula as follows
Cost formula: y = $8.105x + $396.4 where y is total cost and x is number of packages
Using Scatter function of Excel, plot the following chart and then add trend line for cost formula
Requirement c. Using the regression method, estimate the cost formula as follows
Cost formula: y = $8.11x + $396.49 where y is total cost and x is number of packages

Requirement d: Yes, there are factors other than the number of packages that may contribute to variation in shipping cost. For example the weight of the packages, mode of transportation and priority in package delivery also influence shipping costs.
Add Answer to:
6-2A - High-Low Method, Scattergraph, Least-squares Regression Danny Office Supplies shows the following data related to...
Daniel Office Supplies shows the following data related to shipping costs for the first six months...
 Daniel Office Supplies shows the following data related to shipping costs for the first six months of the year: Month January February March April May June Numbers of Packages Shipped 100 120 125 130 110 90 Shipping Cost (RM) 1,200 1,300 1,350 1,500 1,400 1.100 Instruction Compute the fixed and variable cost elements using the high-low method.
Required information Exercise 6A-4 High-Low Method; Scattergraph Analysis (LO6-10] (The following information applies to the questions...
 Required information Exercise 6A-4 High-Low Method; Scattergraph Analysis (LO6-10] (The following information applies to the questions displayed below.] Archer Company is a wholesaler of custom-built air-conditioning units for commercial buildings. It gathered the following monthly data relating to units shipped and total shipping expense: Month January February March April May June July Units Shipped 4 7 5 6 8 9 1 Total Shipping Expense $ 1,800 $ 2,300 $ 1,700 $ 2,000 $ 2,300 $ 3,400 $ 1,200 2. Using...
requirea iniormaion Exercise 6A-4 High-Low Method: Scattergraph Analysis [L06-10] The following information applies to the questions...
 requirea iniormaion Exercise 6A-4 High-Low Method: Scattergraph Analysis [L06-10] The following information applies to the questions displayed below) Archer Company is a wholesaler of custom-built air-conditioning units for commercial buildings. It gathered the following monthly data relating to units shipped and total shipping expense: of 3 Units, Total Shipping MonthShippedExpense s 2,408 $ 2,900 $ 2,300 $ 2,600 s 2,900 $ 3,900 s 1,800 January February Manch April May June uly Exercise 6A-4 Part 2 2. Using the high-low method,...
The high low method is generally less accurate than the least squares regression method in analyzing...
The high low method is generally less accurate than the least squares regression method in analyzing expected cost behavior True False
use scattergraph method, high low method, and the least square regression 247 Cost-Volume-Profit Relationships EXHIBIT SA-5...
 use
scattergraph method, high low method, and the least square
regression
247 Cost-Volume-Profit Relationships EXHIBIT SA-5 A Scattergraph Plot for Brentine Hospital Using Microsoft Excel 5:2.000 $10,000 58,000 Maintenance cost 56.000 54.000 52.000 2,000 2000 6.000 4000 Patient Day To prepare a scattergraph plot in Excel, begin by highlighting the data in cells B4 through CIO (as shown in Exhibit 5A-4). From the Charts group within the Insert tab, select the "Scatter" subgroup and then click on the choice that...
use
scattergraph method, high low method, and the least square
regression
247 Cost-Volume-Profit Relationships EXHIBIT SA-5 A Scattergraph Plot for Brentine Hospital Using Microsoft Excel 5:2.000 $10,000 58,000 Maintenance cost 56.000 54.000 52.000 2,000 2000 6.000 4000 Patient Day To prepare a scattergraph plot in Excel, begin by highlighting the data in cells B4 through CIO (as shown in Exhibit 5A-4). From the Charts group within the Insert tab, select the "Scatter" subgroup and then click on the choice that...
Odessa, Inc., manufactures one model of computer desk. The following data are available regarding units shipped...
 Odessa, Inc., manufactures one model of computer desk. The following data are available regarding units shipped and total shipping costs: Number Total of Units Shipping Cost Month Shipped 3500 2.500 February 75 March 45 June July 80 4.000 50 3,450 Required: 1. Prepare a scattergraph of Odessa's shipping cost and draw the line you believe best fits the data. Instructions: 1. Use the point tool (7 points) to plot each Units Shipped / Total cost combination. 2. To enter exact...
please answer A - E! Thank you! 2-20 Scattergraph; high-low method; cost estimation (LO 2) The...
 please answer A - E! Thank you!
2-20 Scattergraph; high-low method; cost estimation (LO 2) The Aust Corporation has gathered the following data on its copy machine costs for the first eight months of the year. Month Number of Copies Total Copy Cost January 40,000 $3,500 February 35,000 $3,200 March 60,000 $4,100 April 80,000 $5,100 May 85,000 $5,600 June 75,000 $4,800 July 82,000 $5,300 August 105,000 $6,000 Required a. Prepare a scattergraph of the cost information and then choose a...
please answer A - E! Thank you!
2-20 Scattergraph; high-low method; cost estimation (LO 2) The Aust Corporation has gathered the following data on its copy machine costs for the first eight months of the year. Month Number of Copies Total Copy Cost January 40,000 $3,500 February 35,000 $3,200 March 60,000 $4,100 April 80,000 $5,100 May 85,000 $5,600 June 75,000 $4,800 July 82,000 $5,300 August 105,000 $6,000 Required a. Prepare a scattergraph of the cost information and then choose a...
4. High-Low Method: Using the information below and the high-low method, estimate the fixed cost and...
 4. High-Low Method: Using the information below and the high-low method, estimate the fixed cost and the variable cost of shipping, resulting in the cost formula for shipping expense. Total Shipping Expense $1,800 $2,300 $1,700 $2,000 $2.300 $2,700 $1,200 Units Shipped Month 3 January February March April May June 6 4 5 7 2 July Using the above information, what if 9 units were shipped in August?
2. 3. LULU with the fleet of trucks. Express the variable and fixed costs in the...
 2. 3. LULU with the fleet of trucks. Express the variable and fixed costs in the form Y = a +bX. If a truck were driven 80,000 kilometers during a year, what total oper expect to be incurred? a year, what total operating cost would you EXERCISE 5A-4 High-Low Method; Scattergraph Analysis L05-10 Archer Company is a wholesaler of custom-built air-conditioning unit It gathered the following monthly data relating to units shipped and total shipping m-built air-conditioning units for commercial...
Homework EXERCISE 2-14 High-Low Method; Predicting Cost The Lakeshore Hotel's guest-days of occupancy and custodial supplies...
 Homework EXERCISE 2-14 High-Low Method; Predicting Cost The Lakeshore Hotel's guest-days of occupancy and custodial supplies expense over the last seven months were: Month March April May June July August September Guest Days of Occupancy 4,000 6.500 8,000 10,500 12,000 9,000 7,500 Custodial Supplies Expense $7,500 $8.250 $10,500 $12,000 $13,500 $10,750 $9.750 Guest-days is a measure of the overall activity at the hotel. For example, a guest who stays at the hotel for three days is counted as three guest-days....
 Daniel Office Supplies shows the following data related to shipping costs for the first six months of the year: Month January February March April May June Numbers of Packages Shipped 100 120 125 130 110 90 Shipping Cost (RM) 1,200 1,300 1,350 1,500 1,400 1.100 Instruction Compute the fixed and variable cost elements using the high-low method.
 Required information Exercise 6A-4 High-Low Method; Scattergraph Analysis (LO6-10] (The following information applies to the questions displayed below.] Archer Company is a wholesaler of custom-built air-conditioning units for commercial buildings. It gathered the following monthly data relating to units shipped and total shipping expense: Month January February March April May June July Units Shipped 4 7 5 6 8 9 1 Total Shipping Expense $ 1,800 $ 2,300 $ 1,700 $ 2,000 $ 2,300 $ 3,400 $ 1,200 2. Using...
 requirea iniormaion Exercise 6A-4 High-Low Method: Scattergraph Analysis [L06-10] The following information applies to the questions displayed below) Archer Company is a wholesaler of custom-built air-conditioning units for commercial buildings. It gathered the following monthly data relating to units shipped and total shipping expense: of 3 Units, Total Shipping MonthShippedExpense s 2,408 $ 2,900 $ 2,300 $ 2,600 s 2,900 $ 3,900 s 1,800 January February Manch April May June uly Exercise 6A-4 Part 2 2. Using the high-low method,...
 use
scattergraph method, high low method, and the least square
regression
247 Cost-Volume-Profit Relationships EXHIBIT SA-5 A Scattergraph Plot for Brentine Hospital Using Microsoft Excel 5:2.000 $10,000 58,000 Maintenance cost 56.000 54.000 52.000 2,000 2000 6.000 4000 Patient Day To prepare a scattergraph plot in Excel, begin by highlighting the data in cells B4 through CIO (as shown in Exhibit 5A-4). From the Charts group within the Insert tab, select the "Scatter" subgroup and then click on the choice that...
use
scattergraph method, high low method, and the least square
regression
247 Cost-Volume-Profit Relationships EXHIBIT SA-5 A Scattergraph Plot for Brentine Hospital Using Microsoft Excel 5:2.000 $10,000 58,000 Maintenance cost 56.000 54.000 52.000 2,000 2000 6.000 4000 Patient Day To prepare a scattergraph plot in Excel, begin by highlighting the data in cells B4 through CIO (as shown in Exhibit 5A-4). From the Charts group within the Insert tab, select the "Scatter" subgroup and then click on the choice that...
 Odessa, Inc., manufactures one model of computer desk. The following data are available regarding units shipped and total shipping costs: Number Total of Units Shipping Cost Month Shipped 3500 2.500 February 75 March 45 June July 80 4.000 50 3,450 Required: 1. Prepare a scattergraph of Odessa's shipping cost and draw the line you believe best fits the data. Instructions: 1. Use the point tool (7 points) to plot each Units Shipped / Total cost combination. 2. To enter exact...
 please answer A - E! Thank you!
2-20 Scattergraph; high-low method; cost estimation (LO 2) The Aust Corporation has gathered the following data on its copy machine costs for the first eight months of the year. Month Number of Copies Total Copy Cost January 40,000 $3,500 February 35,000 $3,200 March 60,000 $4,100 April 80,000 $5,100 May 85,000 $5,600 June 75,000 $4,800 July 82,000 $5,300 August 105,000 $6,000 Required a. Prepare a scattergraph of the cost information and then choose a...
please answer A - E! Thank you!
2-20 Scattergraph; high-low method; cost estimation (LO 2) The Aust Corporation has gathered the following data on its copy machine costs for the first eight months of the year. Month Number of Copies Total Copy Cost January 40,000 $3,500 February 35,000 $3,200 March 60,000 $4,100 April 80,000 $5,100 May 85,000 $5,600 June 75,000 $4,800 July 82,000 $5,300 August 105,000 $6,000 Required a. Prepare a scattergraph of the cost information and then choose a...
 4. High-Low Method: Using the information below and the high-low method, estimate the fixed cost and the variable cost of shipping, resulting in the cost formula for shipping expense. Total Shipping Expense $1,800 $2,300 $1,700 $2,000 $2.300 $2,700 $1,200 Units Shipped Month 3 January February March April May June 6 4 5 7 2 July Using the above information, what if 9 units were shipped in August?
 2. 3. LULU with the fleet of trucks. Express the variable and fixed costs in the form Y = a +bX. If a truck were driven 80,000 kilometers during a year, what total oper expect to be incurred? a year, what total operating cost would you EXERCISE 5A-4 High-Low Method; Scattergraph Analysis L05-10 Archer Company is a wholesaler of custom-built air-conditioning unit It gathered the following monthly data relating to units shipped and total shipping m-built air-conditioning units for commercial...
 Homework EXERCISE 2-14 High-Low Method; Predicting Cost The Lakeshore Hotel's guest-days of occupancy and custodial supplies expense over the last seven months were: Month March April May June July August September Guest Days of Occupancy 4,000 6.500 8,000 10,500 12,000 9,000 7,500 Custodial Supplies Expense $7,500 $8.250 $10,500 $12,000 $13,500 $10,750 $9.750 Guest-days is a measure of the overall activity at the hotel. For example, a guest who stays at the hotel for three days is counted as three guest-days....
Most questions answered within 3 hours.
-
Brian makes $34,100 per year. How much can Brian expect to
contribute to FICA taxes in...
asked 39 minutes ago -
To buy a new house you must borrow $155,000. To do this you take
out a...
asked 55 minutes ago -
Spacely Sprockets is evaluating the construction of a new plant
on land the company purchased for...
asked 1 hour ago -
1. Consider a linear regression model of y on K regressors and
an intercept.
(i) Describe...
asked 1 hour ago -
Enter a balanced equation for the reaction between hydrochloric
acid and sodium sulfite.
Express your answer...
asked 1 hour ago -
Give a regular expression describing the language
{x | x ∈ Σ* and x does not...
asked 1 hour ago -
Masses of 1.0 kg, 2.0 kg, and 3.0 kg are each separately subject
to a net...
asked 2 hours ago -
The mode of philosophical argumentation and thought. How do
philosophers think and write? What is important...
asked 2 hours ago -
At the beginning of the unit, you were asked whether you thought
it was appropriate or...
asked 2 hours ago -
Calculate the grams of carbon in 9.32 x 10+23 molecules of
benzene (C6H6).
asked 2 hours ago -
A 5-year Treasury bond has a 4.95% yield. A 10-year Treasury
bond yields 6.6%, and a...
asked 2 hours ago -
suppose you own a chain of five restaurants in
downtown Vancouver. as the manager, you want...
asked 2 hours ago