The dowj.txt file attached to this assignment contains adjusted daily data on the Dow Jones utilities...
The dowj.txt file attached to this assignment contains adjusted daily data on the Dow Jones utilities index from Aug 28 to Dec 18 1972. You should use SPSS to analyze the data.
- Use SPSS to Compute the Mean, median, Q1 (or 25th percentile), Q3 (or 75th percentile), Standard deviation. Copy your table over to your word document.
- Plot the histogram and Boxplot. Discuss if the distribution of the adjusted data is symmetric or skewed.
- Create the normal probability plot (Normality Plot from SPSS). Can we assume that the data are normally distributed?
- Use the normal approximation (Table or Excel method) defined by the sample average and standard deviation computed above and compute the probability that the adjusted index is larger than 0.75
- Compute the first and third quartiles using the normal approximation and compare them with the sample first and third quartiles (25th & 75th percentile) computed by SPSS. Write the answers in the Word document. You should also include the graphs with your answers. Just copy and paste the graphs in your word document.
| dowj |
| 0.25 |
| 0.26 |
| -0.13 |
| -0.19 |
| -0.09 |
| 0.38 |
| -0.1 |
| 0.1 |
| 0.41 |
| 0.45 |
| 0.29 |
| 0 |
| 0.06 |
| 0.23 |
| 0.48 |
| -0.23 |
| -0.25 |
| -0.42 |
| 0.06 |
| -0.15 |
| -0.36 |
| -0.67 |
| 0 |
| -0.16 |
| -0.51 |
| -0.25 |
| -0.1 |
| -0.32 |
| -0.29 |
| 0.13 |
| 0.1 |
| 0.28 |
| 0.32 |
| -0.06 |
| -0.58 |
| -0.22 |
| -0.48 |
| -0.45 |
| -1.21 |
| -0.29 |
| -0.41 |
| -0.8 |
| -0.54 |
| -0.04 |
| -0.44 |
| -1.19 |
| -0.44 |
| -0.77 |
| -0.51 |
| 0.09 |
| 0.42 |
| -0.38 |
| -0.48 |
| -0.83 |
| -0.16 |
| -0.42 |
| -0.41 |
| -0.3 |
| -1.53 |
| -0.32 |
| -0.03 |
| 0.77 |
| 0.35 |
| 0.16 |
| -0.16 |
| -0.09 |
| 0.06 |
| 0 |
| 0.22 |
| -0.35 |
| 0.51 |
| -0.06 |
| -0.13 |
| 0.19 |
| 0.58 |
| 0.09 |
| 0.77 |
Homework Answers
1. Use SPSS to Compute the Mean, median, Q1 (or 25th percentile), Q3 (or 75th percentile), Standard deviation. Copy your table over to your word document.
Ans:
| Statistics | ||
| dowj | ||
| N | Valid | 77 |
| Missing | 0 | |
| Mean | -.1336 | |
| Median | -.1300 | |
| Std. Deviation | .42695 | |
| Percentiles | 25 (Q1) | -.4100 |
| 50 (median) | -.1300 | |
| 75 (Q3) | .1450 | |
2. Plot the histogram and Boxplot. Discuss if the distribution of the adjusted data is symmetric or skewed.
Ans:
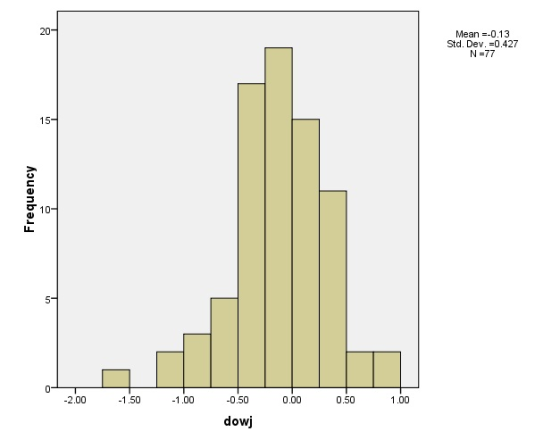

From the histogram and box-plot, we can conclude that the given data is slightly negative skew.
3. Create the normal probability plot (Normality Plot from SPSS). Can we assume that the data are normally distributed?
Ans:

Comment: From the above P-P plot, we can see that most of the values fall on or near to the straight line. Hence, we can assume that the data are normally distributed.
4. Use the normal approximation (Table or Excel method) defined by the sample average and standard deviation computed above and compute the probability that the adjusted index is larger than 0.75.
Ans: The number of the adjusted index (z-score) values which are more than 0.75 is 18. Hence, the probability that the adjusted index is larger than 0.75 is 18/77=0.2338.
5. Compute the first and third quartiles using the normal approximation and compare them with the sample first and third quartiles (25th & 75th percentile) computed by SPSS. Write the answers in the Word document. You should also include the graphs with your answers. Just copy and paste the graphs in your word document.
Ans:
 The first and third quartiles
using the normal approximation and them with the sample first and
third quartiles (25th & 75th percentile)
computed by SPSS are approximately equal.
The first and third quartiles
using the normal approximation and them with the sample first and
third quartiles (25th & 75th percentile)
computed by SPSS are approximately equal.
Add Answer to:
The dowj.txt file attached to this assignment contains adjusted
daily data on the Dow Jones utilities...
2. (25 P) A random number generator was used to generate a 100 numbers listed below....
 2. (25 P) A random number generator was used to generate a 100 numbers listed below. Perform x2 goodness of fit test to check whether the data distributed uniformly in the interval [0, 1] (a= 0.05, state the hypothesis first). 0.01 0.01 0.02 0.03 0.03 0.05 0.05 0.06 0.06 0.06 0.07 0.08 0.08 0.09 0.12 0.13 0.15 0.16 0.18 0.19 0.21 0.24 0.24 0.25 0.25 0.26 0.27 0.27 0.27 0.28 0.28 0.28 0.29 0.29 0.3 0.31 0.32 0.32 0.33 0.33...
Answer question 4-5. Thanks The Global Land and Ocean Temperature Anomalies (the difference between the actual...
 Answer question 4-5. Thanks
The Global Land and Ocean Temperature Anomalies (the difference between the actual temperature and the mean (normal) temperature were calculated every November from 1880-2015, and they are presented below in Table 2 . Create a graphical representation of the data with the Tomperatan Amaier on the y-axis and Yar on the 2. Find the average, standard deviation, and range of the temperature anomalies. Interpret the results. 3. Find the average temperature anomalies and standard deviations for...
Answer question 4-5. Thanks
The Global Land and Ocean Temperature Anomalies (the difference between the actual temperature and the mean (normal) temperature were calculated every November from 1880-2015, and they are presented below in Table 2 . Create a graphical representation of the data with the Tomperatan Amaier on the y-axis and Yar on the 2. Find the average, standard deviation, and range of the temperature anomalies. Interpret the results. 3. Find the average temperature anomalies and standard deviations for...
Answer each question please The Global Land and Ocean Temperature Anomalies (the difference between the actual...
 Answer each question please
The Global Land and Ocean Temperature Anomalies (the difference between the actual temperature and the mean (normal) temperature were calculated every November from 1880-2015, and they are presented below in Table 2 . Create a graphical representation of the data with the Tomperatan Amaier on the y-axis and Yar on the 2. Find the average, standard deviation, and range of the temperature anomalies. Interpret the results. 3. Find the average temperature anomalies and standard deviations for...
Answer each question please
The Global Land and Ocean Temperature Anomalies (the difference between the actual temperature and the mean (normal) temperature were calculated every November from 1880-2015, and they are presented below in Table 2 . Create a graphical representation of the data with the Tomperatan Amaier on the y-axis and Yar on the 2. Find the average, standard deviation, and range of the temperature anomalies. Interpret the results. 3. Find the average temperature anomalies and standard deviations for...
Use Table 8.1, a computer, or a calculator to answer the following. Suppose a candidate for...
 Use Table 8.1, a computer, or a calculator to answer the following. Suppose a candidate for public office is favored by only 47% of the voters. If a sample survey randomly selects 2,500 voters, the percentage in the sample who favor the candidate can be thought of as a measurement from a normal curve with a mean of 47% and a standard deviation of 1%. Based on this information, how often (as a %) would such a survey show that...
Please calculate the chemical shift for Ha using the "Aromatic Proton Shift Calculation" Table. Ha H3C02C...
 Please calculate the chemical shift for Ha using the "Aromatic Proton Shift Calculation" Table. Ha H3C02C CN MezN Hb Hc Answer: Fr Jump to... CHEM 308 Class 15.04.2024 CHEM 308 AROMATIC PROTONS CHEMICAL SHIFT CALCULATION SHEET H Zomo DAH = 7.36 + Zorme + Zmeta + Zpara Z mets Zpara Zi for R (ppm) Substituent R Zortho Zmeta Zpara Zmet Zpara H CH, 0.0 -0.18 0.02 0.02 -0.07 C(CH3) CHCI CH,OH 0.0 -0.11 -0.08 -0.01 -0.07 Zi for R (ppm)...
A 3-dimensional surface contains a saddle point when the point is a global minimum along a line parallel to eith...
 A 3-dimensional surface contains a saddle point when the point is a global minimum along a line parallel to either the x or the y axis, but a global maximum along the other axis. You'll usually see a "U" shape meeting an upside-down "U" shape. The classic horseback riding saddle has one such saddle point, and, not coincidentally, it is a rider's most stable position The input will be a 2-dimensional array AInIn] of numbers, representing a lattice approximation of...
Use the following data: AR AC A P 0.51 0.5 0.16 0.58 0.58 0.3 0.1 0.12...
Use the following data: AR AC A P 0.51 0.5 0.16 0.58 0.58 0.3 0.1 0.12 0.52 0.47 0.2 0.62 0.47 0.36 0.29 0.43 0.61 0.39 -0.14 0.26 0 0.22 0.18 0.5 0.32 0.2 -0.35 0.44 0.53 0.21 0.31 0.2 0.5 0.15 0.16 0.42 0.46 0.1 0.04 0.43 0.34 0.02 -0.25 0.4 Researchers want to know if coffee or some other form of stimulation really allows a person suffering from alcohol intoxication to ‘‘sober-up’’? A sample of 44 male college...
Find five years of monthly returns for two mutual funds, Vanguard’s U.S. Growth Fund and U.S....
Find five years of monthly returns for two mutual funds, Vanguard’s U.S. Growth Fund and U.S. Value Fund, as well as corresponding returns for the S&P 500 and the Treasury-bill rate. (Use Spreadsheet.xls) a. Calculate each fund’s excess rate of return over T-bills in each month. (Negative values should be indicated by a minus sign. Leave no cells blank - be certain to enter "0" wherever required. Do not round intermediate calculations. Round your answers to 2 decimal places.) Total...
0.00 0.20 0.60 0.43 0.75 0.27 1.45 0.19 0.26 0.04 0.61 0.26 0.80 0.36 0.26 1.30 0.01...
0.00 0.20 0.60 0.43 0.75 0.27 1.45 0.19 0.26 0.04 0.61 0.26 0.80 0.36 0.26 1.30 0.01 0.10 0.06 0.19 0.51 1.74 0.01 0.19 0.06 0.19 0.17 0.25 0.24 0.36 0.15 0.36 0.07 1.18 0.83 0.23 0.06 0.01 0.05 0.78 1.14 0.41 0.38 0.40 1.46 0.07 0.63 0.91 0.21 0.75 0.19 0.59 0.12 1.12 0.97 0.02 0.04 0.38 0.56 0.33 0.16 0.16 0.29 0.24 0.02 0.98 0.44 0.19 0.63 0.59 0.50 0.40 1.56 0.12 3.17 0.13 0.41 0.11 0.05 0.59...
Problem 4. A section of a two-lane highway has 12-ft lanes and a design speed of...
 Problem 4. A section of a two-lane highway has 12-ft lanes and a design speed of 75 mi/h. The section contains a vertical curve and a horizontal curve. The vertical curve connects a-2.5% grade and a +1.5% grade. The PVT of this vertical curve is at station 36 + 50. The PC of the horizontal curve is located 294 ft before the PVC of the vertical curve. The horizontal curve has superelevation of 8% and central angle of 38 degrees....
 2. (25 P) A random number generator was used to generate a 100 numbers listed below. Perform x2 goodness of fit test to check whether the data distributed uniformly in the interval [0, 1] (a= 0.05, state the hypothesis first). 0.01 0.01 0.02 0.03 0.03 0.05 0.05 0.06 0.06 0.06 0.07 0.08 0.08 0.09 0.12 0.13 0.15 0.16 0.18 0.19 0.21 0.24 0.24 0.25 0.25 0.26 0.27 0.27 0.27 0.28 0.28 0.28 0.29 0.29 0.3 0.31 0.32 0.32 0.33 0.33...
 Answer question 4-5. Thanks
The Global Land and Ocean Temperature Anomalies (the difference between the actual temperature and the mean (normal) temperature were calculated every November from 1880-2015, and they are presented below in Table 2 . Create a graphical representation of the data with the Tomperatan Amaier on the y-axis and Yar on the 2. Find the average, standard deviation, and range of the temperature anomalies. Interpret the results. 3. Find the average temperature anomalies and standard deviations for...
Answer question 4-5. Thanks
The Global Land and Ocean Temperature Anomalies (the difference between the actual temperature and the mean (normal) temperature were calculated every November from 1880-2015, and they are presented below in Table 2 . Create a graphical representation of the data with the Tomperatan Amaier on the y-axis and Yar on the 2. Find the average, standard deviation, and range of the temperature anomalies. Interpret the results. 3. Find the average temperature anomalies and standard deviations for...
 Answer each question please
The Global Land and Ocean Temperature Anomalies (the difference between the actual temperature and the mean (normal) temperature were calculated every November from 1880-2015, and they are presented below in Table 2 . Create a graphical representation of the data with the Tomperatan Amaier on the y-axis and Yar on the 2. Find the average, standard deviation, and range of the temperature anomalies. Interpret the results. 3. Find the average temperature anomalies and standard deviations for...
Answer each question please
The Global Land and Ocean Temperature Anomalies (the difference between the actual temperature and the mean (normal) temperature were calculated every November from 1880-2015, and they are presented below in Table 2 . Create a graphical representation of the data with the Tomperatan Amaier on the y-axis and Yar on the 2. Find the average, standard deviation, and range of the temperature anomalies. Interpret the results. 3. Find the average temperature anomalies and standard deviations for...
 Use Table 8.1, a computer, or a calculator to answer the following. Suppose a candidate for public office is favored by only 47% of the voters. If a sample survey randomly selects 2,500 voters, the percentage in the sample who favor the candidate can be thought of as a measurement from a normal curve with a mean of 47% and a standard deviation of 1%. Based on this information, how often (as a %) would such a survey show that...
 Please calculate the chemical shift for Ha using the "Aromatic Proton Shift Calculation" Table. Ha H3C02C CN MezN Hb Hc Answer: Fr Jump to... CHEM 308 Class 15.04.2024 CHEM 308 AROMATIC PROTONS CHEMICAL SHIFT CALCULATION SHEET H Zomo DAH = 7.36 + Zorme + Zmeta + Zpara Z mets Zpara Zi for R (ppm) Substituent R Zortho Zmeta Zpara Zmet Zpara H CH, 0.0 -0.18 0.02 0.02 -0.07 C(CH3) CHCI CH,OH 0.0 -0.11 -0.08 -0.01 -0.07 Zi for R (ppm)...
 A 3-dimensional surface contains a saddle point when the point is a global minimum along a line parallel to either the x or the y axis, but a global maximum along the other axis. You'll usually see a "U" shape meeting an upside-down "U" shape. The classic horseback riding saddle has one such saddle point, and, not coincidentally, it is a rider's most stable position The input will be a 2-dimensional array AInIn] of numbers, representing a lattice approximation of...
 Problem 4. A section of a two-lane highway has 12-ft lanes and a design speed of 75 mi/h. The section contains a vertical curve and a horizontal curve. The vertical curve connects a-2.5% grade and a +1.5% grade. The PVT of this vertical curve is at station 36 + 50. The PC of the horizontal curve is located 294 ft before the PVC of the vertical curve. The horizontal curve has superelevation of 8% and central angle of 38 degrees....
Most questions answered within 3 hours.
-
the following reaction occurs in a balloon containing
N2O2 gas
N2O4(g)=2NO2(g)
will the volume of the...
asked 17 minutes ago -
answer the questions throughout this program
public class Day implements Comparable {
Private Boolean atWork;...
asked 25 minutes ago -
This is C++ code for parking fee management program
#include <iostream>
#include <iomanip>
using namespace std;...
asked 36 minutes ago -
The free energy change for the following reaction at 25 °C, when
[Sn2+] = 1.17 M...
asked 2 hours ago -
An MNE is this kind of industry when competition in one country
is essentially independent of...
asked 3 hours ago -
. For this set of questions, determine what
proportion of a normal distribution is located betweeneach...
asked 4 hours ago -
A college student is employed as a door-to-door newspaper
salesman. Historical data suggests that the student...
asked 5 hours ago -
MATLAB HW 11 problem using Switch Case and Input commands
Write a script file that calculates...
asked 5 hours ago -
Considering gravitational time dilation, calculate the time that
passes in Earth’s surface while 1 hour passes...
asked 5 hours ago -
Minitab Problem: Take the Lake Hume June rainfall data and find
use the processes outlined in...
asked 6 hours ago -
X Company is trying to decide whether to continue using old
equipment to make Product A...
asked 6 hours ago -
IN PYTHON ONLY !! Program 2: Re-work
program #5 (WeeklyHours) from the previous assignment such that...
asked 7 hours ago