
Homework Answers

sample mean= 130.05
standard deviation= 9.055
b) Histogram


c) 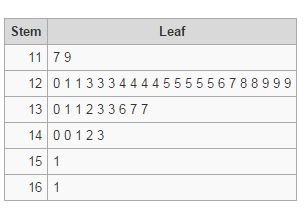
median= 128
lower quartile= 124
upper quartile= 135.25
NOTE : I used excel for finding all values.
Add Answer to:
a. Calculate the sample average. b. Calculate the sample standard deviation. 4. The time to failure...
4.15 construct a box plot for the data in exercise 4.1 down, then across Table 4B...
 4.15 construct a box plot for the data in exercise
4.1
down, then across Table 4B Electronic Component Failure Time 127 125 131 124 123 120 121 136 140 118 131 125 56 Chapter 4 Statistical Inference about Product Table 4E. Continued 119 128 133 137 124 142 123 137 125 124 128 129 130 122 133 124 129 121 142 151 160 125 141 125 140 131 129 126
4.15 construct a box plot for the data in exercise
4.1
down, then across Table 4B Electronic Component Failure Time 127 125 131 124 123 120 121 136 140 118 131 125 56 Chapter 4 Statistical Inference about Product Table 4E. Continued 119 128 133 137 124 142 123 137 125 124 128 129 130 122 133 124 129 121 142 151 160 125 141 125 140 131 129 126
Please do NOT use Minitab - show all calculations for creating the probability plot. Using Excel...
 Please do NOT use Minitab - show all calculations for creating
the probability plot. Using Excel is okay.
Reconsider Problem 3 in Homework 3. Is the set of measurements well described by a normal distribution? Show all the calculations. The measurements of a temperature sensor (in °F) are shown below. 124 118 131 125 133 123 120 119 128 133 127 125 131 124 129 121 142 151 160 125 121 136 140 137 125 124 128 129 130 141...
Please do NOT use Minitab - show all calculations for creating
the probability plot. Using Excel is okay.
Reconsider Problem 3 in Homework 3. Is the set of measurements well described by a normal distribution? Show all the calculations. The measurements of a temperature sensor (in °F) are shown below. 124 118 131 125 133 123 120 119 128 133 127 125 131 124 129 121 142 151 160 125 121 136 140 137 125 124 128 129 130 141...
The measurements of a temperature sensor (in °F) are provided. Is the set of measurements well...
The measurements of a temperature sensor (in °F) are provided. Is the set of measurements well described by a normal distribution? Calculate the R^2 and R^2 adjusted values. Show all the calculations. Order Temperature (F) 1 118 2 119 3 120 4 121 5 121 6 122 7 123 8 123 9 124 10 124 11 124 12 124 13 125 14 125 15 125 16 125 17 125 18 126 19 127 20 128 21 128 22 129 23...
(Use Excel) italy common for people to put on weight when they quit smoking While a...
 (Use Excel) italy common for people to put on weight when they quit smoking While a small weight gain is normal c e weight gain can create new health concerns that brode the benefits of not smoking. The accompanying table shows a portion of the weight data for 50 women before quitting and six months after quitting Use Table 2 Weight Before Quilling 140 144 138 Weight After Quilling 155 142 163 146 129 149 136 127 158 145 118...
Assume the following table of observations in a dataset represents a sample of systolic blood pressures...
Assume the following table of observations in a dataset represents a sample of systolic blood pressures (mmHG) from a population. Patient Systolic BP (mmHG) Patient Systolic BP (mmHG) Patient Systolic BP (mmHG) A 117 F 121 K 133 B 123 G 126 L 149 C 118 H 125 M 128 D 129 I 131 N 126 E 118 J 124 O 131 A) Calculate a 5 point summary for the data
How do I plot a series graph with this data provided? Month 1987 1988 1989 1990...
How do I plot a series graph with this data provided? Month 1987 1988 1989 1990 1991 1992 1993 1994 1995 1996 Jan 95 104 101 88 132 125 111 127 119 147 Feb 94 100 96 110 109 118 123 129 147 146 Mar 98 99 82 129 101 121 121 132 164 133 Apr 96 88 84 113 111 140 139 108 135 148 May 95 89 85 114 140 141 119 115 124 141 Jun 115 108...
SCENARIO You are a Marriage and Family Therapist. In your practice, you’ve noticed that children seem...
SCENARIO You are a Marriage and Family Therapist. In your practice, you’ve noticed that children seem to be dramatically influenced by their parent’s marital relationship. You think that changes in marital relationship can be predictive of a child’s overall life satisfaction. In order to test this, you collect data from both children and their parents (n=20). You give the children in your study the Child Psychological Wellbeing Inventory (CPWI) and their parents the Marital Satisfaction Survey (MSS). Using the data...
Grambling State University Department of Mathematies and Physics Probability and Statisties 1,SPLING 2019 Exam I, 01/23/2019...
 Grambling State University Department of Mathematies and Physics Probability and Statisties 1,SPLING 2019 Exam I, 01/23/2019 Please show all the details I. The amount of protein(in grams) for a variety of some fast food reported here. 1. Construct a frequency distribution using 6 cl a histogram, a frequency polygon, and an ogive for the data. 123, 130, 120, 127, 144, 126, 135, 120, 129, 129, 125, 115, 118, 127, 119, 122, 112, 126, 134, 115, 127, 135, 126, 143, 135,...
(1 point) Archeologists have discovered a sample of ancient Egyptian skulls from two different time periods,...
 (1 point) Archeologists have discovered a sample of ancient Egyptian skulls from two different time periods, 4000 B.C. and 150 A.D. They believe that the mean maximum skull breadth (the width of the skull at its widest part) has increased from 4000 B.C. to 150 A.C.A sample of 13 Egyptian skull breadth (in mm) from each time period is show below: 4000 B.C. 118, 125, 134, 129, 122, 129, 132, 129 150 A.D. 132, 131, 137, 140, 142, 134, 132,...
Question 3 [16 marks] The average particulate concentration, in micrograms per cubic meter, was measured in...
 Question 3 [16 marks] The average particulate concentration, in micrograms per cubic meter, was measured in a petrochemical complex at 36 randomly chosen times, with the following concentrations resulting: 5, 18, 15, 77, 133, 220, 130, 85, 103, 125, 80, 107, 124, 106, 113, 165, 137, 125, 124, 65, 82, 95, 77, 115, 70, 110, 144, 128, 133, 81, 129, 114, 45, 92, 117, 153 a) Represent the data in a histogram. b) [l mark] Is the histogram approximately normal?...
 4.15 construct a box plot for the data in exercise
4.1
down, then across Table 4B Electronic Component Failure Time 127 125 131 124 123 120 121 136 140 118 131 125 56 Chapter 4 Statistical Inference about Product Table 4E. Continued 119 128 133 137 124 142 123 137 125 124 128 129 130 122 133 124 129 121 142 151 160 125 141 125 140 131 129 126
4.15 construct a box plot for the data in exercise
4.1
down, then across Table 4B Electronic Component Failure Time 127 125 131 124 123 120 121 136 140 118 131 125 56 Chapter 4 Statistical Inference about Product Table 4E. Continued 119 128 133 137 124 142 123 137 125 124 128 129 130 122 133 124 129 121 142 151 160 125 141 125 140 131 129 126
 Please do NOT use Minitab - show all calculations for creating
the probability plot. Using Excel is okay.
Reconsider Problem 3 in Homework 3. Is the set of measurements well described by a normal distribution? Show all the calculations. The measurements of a temperature sensor (in °F) are shown below. 124 118 131 125 133 123 120 119 128 133 127 125 131 124 129 121 142 151 160 125 121 136 140 137 125 124 128 129 130 141...
Please do NOT use Minitab - show all calculations for creating
the probability plot. Using Excel is okay.
Reconsider Problem 3 in Homework 3. Is the set of measurements well described by a normal distribution? Show all the calculations. The measurements of a temperature sensor (in °F) are shown below. 124 118 131 125 133 123 120 119 128 133 127 125 131 124 129 121 142 151 160 125 121 136 140 137 125 124 128 129 130 141...
 (Use Excel) italy common for people to put on weight when they quit smoking While a small weight gain is normal c e weight gain can create new health concerns that brode the benefits of not smoking. The accompanying table shows a portion of the weight data for 50 women before quitting and six months after quitting Use Table 2 Weight Before Quilling 140 144 138 Weight After Quilling 155 142 163 146 129 149 136 127 158 145 118...
 Grambling State University Department of Mathematies and Physics Probability and Statisties 1,SPLING 2019 Exam I, 01/23/2019 Please show all the details I. The amount of protein(in grams) for a variety of some fast food reported here. 1. Construct a frequency distribution using 6 cl a histogram, a frequency polygon, and an ogive for the data. 123, 130, 120, 127, 144, 126, 135, 120, 129, 129, 125, 115, 118, 127, 119, 122, 112, 126, 134, 115, 127, 135, 126, 143, 135,...
 (1 point) Archeologists have discovered a sample of ancient Egyptian skulls from two different time periods, 4000 B.C. and 150 A.D. They believe that the mean maximum skull breadth (the width of the skull at its widest part) has increased from 4000 B.C. to 150 A.C.A sample of 13 Egyptian skull breadth (in mm) from each time period is show below: 4000 B.C. 118, 125, 134, 129, 122, 129, 132, 129 150 A.D. 132, 131, 137, 140, 142, 134, 132,...
 Question 3 [16 marks] The average particulate concentration, in micrograms per cubic meter, was measured in a petrochemical complex at 36 randomly chosen times, with the following concentrations resulting: 5, 18, 15, 77, 133, 220, 130, 85, 103, 125, 80, 107, 124, 106, 113, 165, 137, 125, 124, 65, 82, 95, 77, 115, 70, 110, 144, 128, 133, 81, 129, 114, 45, 92, 117, 153 a) Represent the data in a histogram. b) [l mark] Is the histogram approximately normal?...
Most questions answered within 3 hours.
-
Part 1- Inventory: You own a toy company and
you are producing wooden rocking horses. Assume...
asked 4 minutes ago -
What is aromaticity?
Identify aromatic molecules, especially those containing O, N,
S and B
asked 7 minutes ago -
A rubber solid circular wheel of uniform density spins about it
axis at rate of 60...
asked 19 minutes ago -
DNA evidence from an early human skeleton in Britain, shows that
early inhabitants of were blue...
asked 10 minutes ago -
Financial data for Joel de Paris, Inc., for last year
follow:
Joel de Paris, Inc.
Balance...
asked 19 minutes ago -
To practice Problem-Solving Strategy 19.1 Work in Ideal-gas
Processes.
A cylinder with initial volume V contains...
asked 27 minutes ago -
Depreciation for Partial Periods Bean Delivery Company purchased
a new delivery truck for $35,400 on April...
asked 32 minutes ago -
Q 5.23:
Jonathan has been doing calculations to determine a missing
component. So far he has...
asked 30 minutes ago -
Use indifference curve and the daily income-leisure choice model
to explain graphically the behavior of employees...
asked 50 minutes ago -
Record the following transactions of Fashion Park in a
general journal. Fashion Park must charge 8...
asked 50 minutes ago -
Chapter 08 Python Assignment: Question 1-5
Please I need help in my python course.
Question 1...
asked 55 minutes ago -
1.
In a study of the effectiveness of
a new pain killer,
4646
out of
821821...
asked 1 hour ago