What is the EBIT/operating profit margin for 2017 and 2018?


Homework Answers


Add Answer to:
What is the EBIT/operating profit margin for 2017 and 2018?
Fiscal year is October-September. All values...
vertical analysis of Air canada financial statement 2018-19 Fiscal year is January-December. All values CAD Thousands...
 vertical analysis of Air canada financial statement 2018-19
Fiscal year is January-December. All values CAD Thousands 2019 2018 Sales/Revenue 486,600,0 454,900.0 Sales Growth 6.97% 18.80% Cost of Goods Sold (COGS) incl. D&A 369,400.0 344,700.0 COGS excluding D&A 275,400.0 278,600.0 Depreciation & Amortization Expense 94,000,0 66,100.0 Depreciation 94,000.0 66,100.0 COGS Growth 717% 24.04% Gross Income 117,200.0 110,200.0 Gross Income Growth 6.35% 4.95 Gross Profit Margin 24.09% SG&A Expense 60,600,0 50,300.0 Other SG&A 60,600.0 50.300.0 Income Tax 9,200.0 9,100.0 Income Tax -...
vertical analysis of Air canada financial statement 2018-19
Fiscal year is January-December. All values CAD Thousands 2019 2018 Sales/Revenue 486,600,0 454,900.0 Sales Growth 6.97% 18.80% Cost of Goods Sold (COGS) incl. D&A 369,400.0 344,700.0 COGS excluding D&A 275,400.0 278,600.0 Depreciation & Amortization Expense 94,000,0 66,100.0 Depreciation 94,000.0 66,100.0 COGS Growth 717% 24.04% Gross Income 117,200.0 110,200.0 Gross Income Growth 6.35% 4.95 Gross Profit Margin 24.09% SG&A Expense 60,600,0 50,300.0 Other SG&A 60,600.0 50.300.0 Income Tax 9,200.0 9,100.0 Income Tax -...
Balance Sheet Assets Fiscal year is January-December. All values USD millions. 2017 Cash & Short Term...
Balance Sheet Assets Fiscal year is January-December. All values USD millions. 2017 Cash & Short Term Investments 18.3B Total Accounts Receivable 13.49B Inventories 8.77B Other Current Assets 2.54B Total Current Assets 43.09B 2017 Net Property, Plant & Equipment 17.01B Total Investments and Advances 751M Long-Term Note Receivable - Intangible Assets 85.13B Other Assets 4.22B Total Assets 157.3B Liabilities & Shareholders' Equity 2017 ST Debt & Current Portion LT Debt 3.91B Accounts Payable 7.31B Income Tax Payable 1.85B Other Current Liabilities...
I need the following 10 financial ratios, with work shown, for the company Amazon for 2017...
I need the following 10 financial ratios, with work shown, for the company Amazon for 2017 & 2018 Profit margin on sales operating profit margin ROA ROE Total assets turnover Fixed assets turnover Current liquidity Quick liquidity Debt-to -asset ratio P/E Fiscal year is January-December. All values USD Millions. 2018 2017 2016 2015 2014 5-year trend Sales/Revenue 232,887 177,866 135,987 107,006 88,988 Sales Growth 30.93% 30.80% 27.08% 20.25% - Cost of Goods Sold (COGS) incl. D&A 139,156 111,934 88,265 71,651...
Qualcomm Balance Sheet 2020 Cash & Short Term Investments 12,260 Cash Only 11,839 Short-Term Investments 421...
Qualcomm Balance Sheet 2020 Cash & Short Term Investments 12,260 Cash Only 11,839 Short-Term Investments 421 Cash & Short Term Investments Growth 1.42% Cash & ST Investments / Total Assets 37.20% Total Accounts Receivable 2,471 Accounts Receivables, Net 2,457 Accounts Receivables, Gross 2,504 Bad Debt/Doubtful Accounts -47 Other Receivables 14 Accounts Receivable Growth -14.91% Accounts Receivable Turnover 9.82 Inventories 1,400 Finished Goods 656 Work in Progress 667 Raw Materials 77 Other Current Assets 634 Miscellaneous Current Assets 634 Total Current...
Nvidia Balance Sheet 2020 Cash & Short Term Investments 10,897 Cash Only 10,896 Short-Term Investments 1...
Nvidia Balance Sheet 2020 Cash & Short Term Investments 10,897 Cash Only 10,896 Short-Term Investments 1 Cash & Short Term Investments Growth 46.82% Cash & ST Investments / Total Assets 62.93% Total Accounts Receivable 1,657 Accounts Receivables, Net 1,657 Accounts Receivables, Gross 1,659 Bad Debt/Doubtful Accounts -2 Accounts Receivable Growth 16.36% Accounts Receivable Turnover 6.59 Inventories 979 Finished Goods 465 Work in Progress 265 Raw Materials 249 Other Current Assets 157 Miscellaneous Current Assets 157 Total Current Assets 13,690 Net...
What is the asset utilization for 2017 and 2018? 1 Annual Financials for Microsoft Corp. 2...
 What is the asset utilization for 2017 and 2018?
1 Annual Financials for Microsoft Corp. 2 Fiscal year is July-June. All values USD millions. Income Statement 2017 Sales Revenue 96.02 6 Cost of Goods Sold (COGS) incl. D&A 34.62 7 COGS excluding D&A 26.77 8 Depreciation & Amortization Expense 7.86 Depreciation 6.1 10 Amortization of Intangibles 1.76 Gross Income 61.4 2018 110.18 38.97 29.02 9.95 7.7 2.25 71.21 Fiscal year is October September. All values USD millions. Balance Sheet Assets...
What is the asset utilization for 2017 and 2018?
1 Annual Financials for Microsoft Corp. 2 Fiscal year is July-June. All values USD millions. Income Statement 2017 Sales Revenue 96.02 6 Cost of Goods Sold (COGS) incl. D&A 34.62 7 COGS excluding D&A 26.77 8 Depreciation & Amortization Expense 7.86 Depreciation 6.1 10 Amortization of Intangibles 1.76 Gross Income 61.4 2018 110.18 38.97 29.02 9.95 7.7 2.25 71.21 Fiscal year is October September. All values USD millions. Balance Sheet Assets...
What is the current ratio? (1:1) What is the debt ratio? (%) Show work please 1....
 What is the current ratio? (1:1)
What is the debt ratio? (%)
Show work please
1. What is the current ratio? (1:1) 2. What is the debt ratio? (%) *Income Statement Income StatementBalance SheetCash Flow Statement Annual Financials Annual Financials for Lowe's Cos. View Ratios Fiscal year is February January. All values USD millions 2019 Sales/Revenue 71.31B Cost of Goods Sold (COGS) incl. D&A 49.88B COGS excluding D&A 48.27B Depreciation & Amortization Expense 1.61B Depreciation 1.48B Amortization of Intangibles 130M...
What is the current ratio? (1:1)
What is the debt ratio? (%)
Show work please
1. What is the current ratio? (1:1) 2. What is the debt ratio? (%) *Income Statement Income StatementBalance SheetCash Flow Statement Annual Financials Annual Financials for Lowe's Cos. View Ratios Fiscal year is February January. All values USD millions 2019 Sales/Revenue 71.31B Cost of Goods Sold (COGS) incl. D&A 49.88B COGS excluding D&A 48.27B Depreciation & Amortization Expense 1.61B Depreciation 1.48B Amortization of Intangibles 130M...
6 ANNUAL FINANCIAL REPORT All values USD Millions. Fiscal year is February-January. All values USD Millions....
 6 ANNUAL FINANCIAL REPORT All values USD Millions. Fiscal year is February-January. All values USD Millions. BALANCE SHEET Assets Cash & Short Term Investments Total Accounts Receivable Inventories Other Current Assets Total Current Assets 2020 723 15 3,537 374 4,649 2019 934 29 3,475 397 4,835 9,743 145 14,555 7,428 182 12,469 3 Net Property, Plant & Equipment 4 Other Assets 5 Total Assets -6 17 Liabilities & Shareholders' Equity 18 ST Debt & Current Portion LT Debt 19 Accounts...
what is the current ratio? (1:1) what is the debt ratio? (%) please show work 1....
 what is the current ratio? (1:1)
what is the debt ratio? (%)
please show work
1. What is the current ratio? (1:1) 2. What is the debt ratio? (%) *Income Statement Income Statement Balance SheetCash Flow Statement Annual Financials Quarter Financials Quarterly Financials for Lowe's Cos. View Ratios All values USD millions. 31-Oct- 2018 31-Jan- 2019 30-Apr- 2019 31-Jul- 2019 31-Oct- 2019 5-qtr trend Sales/Revenue 17.42B 15.65B 17.74B 20.99B 7.39B Cost of Goods Sold (COGS) incl. D&A 12.19B 11.12B 12.46B...
what is the current ratio? (1:1)
what is the debt ratio? (%)
please show work
1. What is the current ratio? (1:1) 2. What is the debt ratio? (%) *Income Statement Income Statement Balance SheetCash Flow Statement Annual Financials Quarter Financials Quarterly Financials for Lowe's Cos. View Ratios All values USD millions. 31-Oct- 2018 31-Jan- 2019 30-Apr- 2019 31-Jul- 2019 31-Oct- 2019 5-qtr trend Sales/Revenue 17.42B 15.65B 17.74B 20.99B 7.39B Cost of Goods Sold (COGS) incl. D&A 12.19B 11.12B 12.46B...
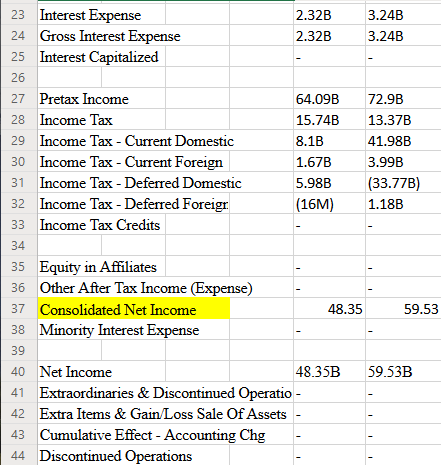
Income Statement Sales/Revenue Total revenue 76,480,000,000 Cost of Revenue 25,110,000,000 Gross Profit 51,370,000,000 Operating Exp 31,810,000,000...
Income Statement Sales/Revenue Total revenue 76,480,000,000 Cost of Revenue 25,110,000,000 Gross Profit 51,370,000,000 Operating Exp 31,810,000,000 Selling General & Admin - Other Operating Expense 3,390,000,000 Unusual Expense 16,180,000,000 EBIT after Unusual Expense 2,130,000,000 Non Operating Income/Expense 385,000,000 Equity in Affiliates (Pretax) 1,020,000,000 Interest Expense 17,670,000,000 Pretax Income 16,370,000,000 Other After Tax Income (Expense) 1,300,000,000 Consolidated Net Income - Minority Interest Expense 1,300,000,000 Net Income - Discontinued Operations 1,300,000,000 Net Income After Extraordinaries - Preferred Dividends 1,300,000,000 Net Income Available to...
 vertical analysis of Air canada financial statement 2018-19
Fiscal year is January-December. All values CAD Thousands 2019 2018 Sales/Revenue 486,600,0 454,900.0 Sales Growth 6.97% 18.80% Cost of Goods Sold (COGS) incl. D&A 369,400.0 344,700.0 COGS excluding D&A 275,400.0 278,600.0 Depreciation & Amortization Expense 94,000,0 66,100.0 Depreciation 94,000.0 66,100.0 COGS Growth 717% 24.04% Gross Income 117,200.0 110,200.0 Gross Income Growth 6.35% 4.95 Gross Profit Margin 24.09% SG&A Expense 60,600,0 50,300.0 Other SG&A 60,600.0 50.300.0 Income Tax 9,200.0 9,100.0 Income Tax -...
vertical analysis of Air canada financial statement 2018-19
Fiscal year is January-December. All values CAD Thousands 2019 2018 Sales/Revenue 486,600,0 454,900.0 Sales Growth 6.97% 18.80% Cost of Goods Sold (COGS) incl. D&A 369,400.0 344,700.0 COGS excluding D&A 275,400.0 278,600.0 Depreciation & Amortization Expense 94,000,0 66,100.0 Depreciation 94,000.0 66,100.0 COGS Growth 717% 24.04% Gross Income 117,200.0 110,200.0 Gross Income Growth 6.35% 4.95 Gross Profit Margin 24.09% SG&A Expense 60,600,0 50,300.0 Other SG&A 60,600.0 50.300.0 Income Tax 9,200.0 9,100.0 Income Tax -...
 What is the asset utilization for 2017 and 2018?
1 Annual Financials for Microsoft Corp. 2 Fiscal year is July-June. All values USD millions. Income Statement 2017 Sales Revenue 96.02 6 Cost of Goods Sold (COGS) incl. D&A 34.62 7 COGS excluding D&A 26.77 8 Depreciation & Amortization Expense 7.86 Depreciation 6.1 10 Amortization of Intangibles 1.76 Gross Income 61.4 2018 110.18 38.97 29.02 9.95 7.7 2.25 71.21 Fiscal year is October September. All values USD millions. Balance Sheet Assets...
What is the asset utilization for 2017 and 2018?
1 Annual Financials for Microsoft Corp. 2 Fiscal year is July-June. All values USD millions. Income Statement 2017 Sales Revenue 96.02 6 Cost of Goods Sold (COGS) incl. D&A 34.62 7 COGS excluding D&A 26.77 8 Depreciation & Amortization Expense 7.86 Depreciation 6.1 10 Amortization of Intangibles 1.76 Gross Income 61.4 2018 110.18 38.97 29.02 9.95 7.7 2.25 71.21 Fiscal year is October September. All values USD millions. Balance Sheet Assets...
 What is the current ratio? (1:1)
What is the debt ratio? (%)
Show work please
1. What is the current ratio? (1:1) 2. What is the debt ratio? (%) *Income Statement Income StatementBalance SheetCash Flow Statement Annual Financials Annual Financials for Lowe's Cos. View Ratios Fiscal year is February January. All values USD millions 2019 Sales/Revenue 71.31B Cost of Goods Sold (COGS) incl. D&A 49.88B COGS excluding D&A 48.27B Depreciation & Amortization Expense 1.61B Depreciation 1.48B Amortization of Intangibles 130M...
What is the current ratio? (1:1)
What is the debt ratio? (%)
Show work please
1. What is the current ratio? (1:1) 2. What is the debt ratio? (%) *Income Statement Income StatementBalance SheetCash Flow Statement Annual Financials Annual Financials for Lowe's Cos. View Ratios Fiscal year is February January. All values USD millions 2019 Sales/Revenue 71.31B Cost of Goods Sold (COGS) incl. D&A 49.88B COGS excluding D&A 48.27B Depreciation & Amortization Expense 1.61B Depreciation 1.48B Amortization of Intangibles 130M...
 6 ANNUAL FINANCIAL REPORT All values USD Millions. Fiscal year is February-January. All values USD Millions. BALANCE SHEET Assets Cash & Short Term Investments Total Accounts Receivable Inventories Other Current Assets Total Current Assets 2020 723 15 3,537 374 4,649 2019 934 29 3,475 397 4,835 9,743 145 14,555 7,428 182 12,469 3 Net Property, Plant & Equipment 4 Other Assets 5 Total Assets -6 17 Liabilities & Shareholders' Equity 18 ST Debt & Current Portion LT Debt 19 Accounts...
 what is the current ratio? (1:1)
what is the debt ratio? (%)
please show work
1. What is the current ratio? (1:1) 2. What is the debt ratio? (%) *Income Statement Income Statement Balance SheetCash Flow Statement Annual Financials Quarter Financials Quarterly Financials for Lowe's Cos. View Ratios All values USD millions. 31-Oct- 2018 31-Jan- 2019 30-Apr- 2019 31-Jul- 2019 31-Oct- 2019 5-qtr trend Sales/Revenue 17.42B 15.65B 17.74B 20.99B 7.39B Cost of Goods Sold (COGS) incl. D&A 12.19B 11.12B 12.46B...
what is the current ratio? (1:1)
what is the debt ratio? (%)
please show work
1. What is the current ratio? (1:1) 2. What is the debt ratio? (%) *Income Statement Income Statement Balance SheetCash Flow Statement Annual Financials Quarter Financials Quarterly Financials for Lowe's Cos. View Ratios All values USD millions. 31-Oct- 2018 31-Jan- 2019 30-Apr- 2019 31-Jul- 2019 31-Oct- 2019 5-qtr trend Sales/Revenue 17.42B 15.65B 17.74B 20.99B 7.39B Cost of Goods Sold (COGS) incl. D&A 12.19B 11.12B 12.46B...
Most questions answered within 3 hours.
-
Three of the compounds have ionic bonds (difference in
electronegativity is greater or equal to 2,...
asked 8 seconds ago -
The route followed by a hiker consists of three displacement
vectors A, B, and C. Vector...
asked 4 minutes ago -
Can
you provide the mechanism for enamine hydrolysis. Any example will
work, thank you.
asked 6 minutes ago -
Exercise 1. Two players, 1 and 2, take turns choosing numbers; 1
goes first. On his...
asked 24 minutes ago -
Are the following two functions overloaded?
int xyz(int x, int y = 100000);
int xyz(int x,...
asked 32 minutes ago -
An interest rate swap has three years of remaining life.
Payments are exchanged annually. Interest at...
asked 39 minutes ago -
Ensign Johnson is domiciled in Georgia. His wife is domiciled in
New York and moved to...
asked 36 minutes ago -
there are many issues that can be addressed when performing a
RCA. Assuming that there is...
asked 38 minutes ago -
ata pertaining to the postretirement health care benefit plan of
Danielson Delivery Service include the following...
asked 40 minutes ago -
Getting along with the members of your team requires good ____
skills.
a.
authoritative
b.
problem...
asked 47 minutes ago -
During June, Propene Company produced 20,000 chainsaw blades.
The standard quantity of material allowed per unit...
asked 53 minutes ago -
Draw the molecular orbital energy level diagrams and write the
electron configurations of (a) Be2, (b)...
asked 54 minutes ago