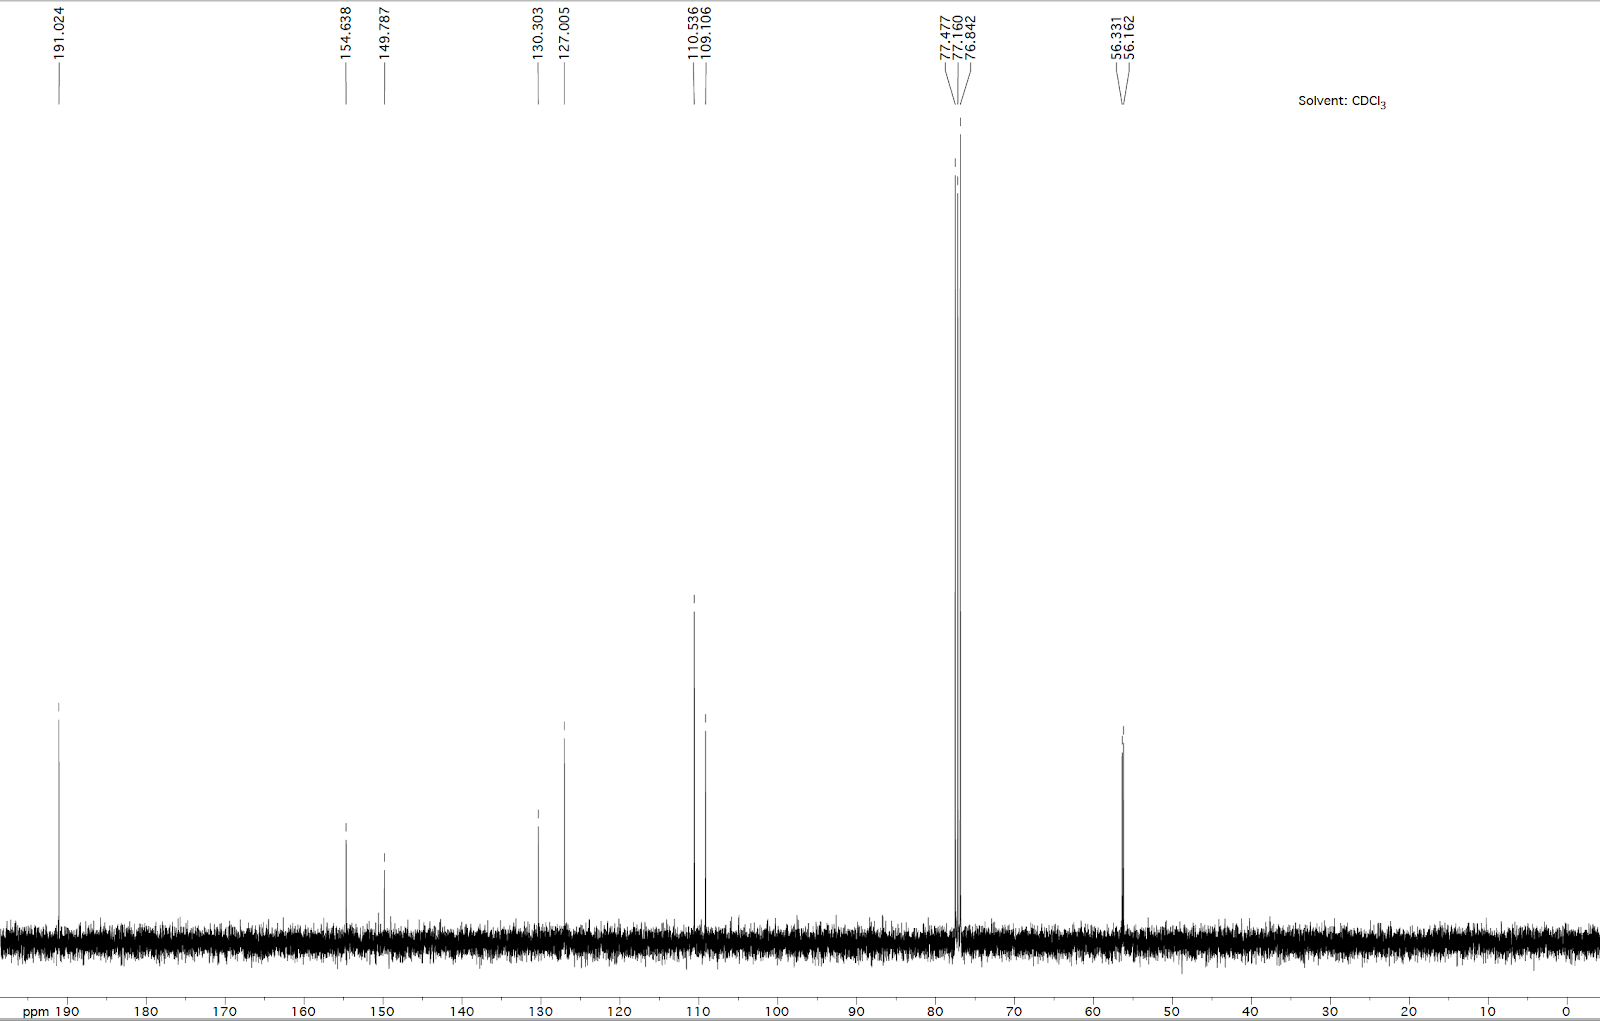
Need help analyzing this CNMR Spectrum
Homework Answers

Add Answer to:
Need help analyzing this CNMR Spectrum
ppm 190 191.024 180 170 . 160 . - 154.638...
8. (10 points) The following spectra correspond to compounds AE listed below con pound to its...
 8. (10 points) The following spectra correspond to compounds AE listed below con pound to its corresponding spestre Label very simal on the spectrum (as Co . ctc.). Spectrum CDCI, 190 160 170 160 150 140 130 120 110 100 80 80 Spectrum 2 70 80 50 40 30 20 10 O le CDCI, 190 180 170 180 150 140 130 120 110 100 90 80 70 60 50 40 30 20 10 O de CDCI, 190 180 170 180...
Suggest a composition for the halogen compound whose mass spectrum is shown below and assign the labeled peaks. 127 100 173 160 158 162 25 48 TITTHTT 160 170 91 208 79 35 160 173 30 40 50 60 70 80 90...
 Suggest a composition for the halogen compound whose mass
spectrum is shown below and assign the labeled peaks.
127 100 173 160 158 162 25 48 TITTHTT 160 170 91 208 79 35 160 173 30 40 50 60 70 80 90 100 110 120 130 140 150 160 170 180 190 200 210 m/z
127 100 173 160 158 162 25 48 TITTHTT 160 170 91 208 79 35 160 173 30 40 50 60 70 80 90 100...
Suggest a composition for the halogen compound whose mass
spectrum is shown below and assign the labeled peaks.
127 100 173 160 158 162 25 48 TITTHTT 160 170 91 208 79 35 160 173 30 40 50 60 70 80 90 100 110 120 130 140 150 160 170 180 190 200 210 m/z
127 100 173 160 158 162 25 48 TITTHTT 160 170 91 208 79 35 160 173 30 40 50 60 70 80 90 100...
label the spectrum OTBS Meo Yome Me H NMR spectrum (CDC13, 400 MHz) 8.5 8.0 7.5...
 label the spectrum
OTBS Meo Yome Me H NMR spectrum (CDC13, 400 MHz) 8.5 8.0 7.5 7.0 6.5 6.0 5.5 5.0 4.5 4.0 f1 (ppm) 3.5 3.0 2.5 2.0 1.5 1.0 0.5 0.0 -0.5 18C NMR spectrum (CDCI, 100 MHz) 210 200 190 180 170 160 150 140 130 120 110 100 fi (ppm) 90 80 70 60 50 40 30 20 10 -10
label the spectrum
OTBS Meo Yome Me H NMR spectrum (CDC13, 400 MHz) 8.5 8.0 7.5 7.0 6.5 6.0 5.5 5.0 4.5 4.0 f1 (ppm) 3.5 3.0 2.5 2.0 1.5 1.0 0.5 0.0 -0.5 18C NMR spectrum (CDCI, 100 MHz) 210 200 190 180 170 160 150 140 130 120 110 100 fi (ppm) 90 80 70 60 50 40 30 20 10 -10
Use the mass spectrum and either the NMR spectrum or the IR spectrum to deduce the...
 Use the mass spectrum and either the NMR spectrum or the IR
spectrum to deduce the structure of the following compound
(c) C8HO3H NMR, 300 MHz, 6.1 ppm (singlet, 2H), 6.9 ppm (doublet, 1H), and 7.3 ppm (singlet, 1H), 7.4 ppm (doublet, 1H), 9.8 ppm (singlet, 1H); significant IR absorbances at 1687, 1602, 1449, 1264, 1038, 929, and 815 cm1. 100 149 (150) 80 60 40 121 63 20 65 91 0 15 20 25 30 35 40 45 50...
Use the mass spectrum and either the NMR spectrum or the IR
spectrum to deduce the structure of the following compound
(c) C8HO3H NMR, 300 MHz, 6.1 ppm (singlet, 2H), 6.9 ppm (doublet, 1H), and 7.3 ppm (singlet, 1H), 7.4 ppm (doublet, 1H), 9.8 ppm (singlet, 1H); significant IR absorbances at 1687, 1602, 1449, 1264, 1038, 929, and 815 cm1. 100 149 (150) 80 60 40 121 63 20 65 91 0 15 20 25 30 35 40 45 50...
assinments of cnmr of styrene oxide ppm 140 — 137.598 130 128.476 128.155 --125.472 120 10...
 assinments of cnmr of styrene oxide
ppm 140 — 137.598 130 128.476 128.155 --125.472 120 10 13C NMR spectrum (100 MHz CDCI) 100 90 80 77.363 77.045 -76.727 70 60 52.334 -51.164 50 40 30 20 10 6
assinments of cnmr of styrene oxide
ppm 140 — 137.598 130 128.476 128.155 --125.472 120 10 13C NMR spectrum (100 MHz CDCI) 100 90 80 77.363 77.045 -76.727 70 60 52.334 -51.164 50 40 30 20 10 6
the compound. Trspectaldaa toanswer the following questions and deduce the structure of compound has molecular formula...
 the compound. Trspectaldaa toanswer the following questions and deduce the structure of compound has molecular formula C1zH sCIO. 6H CDCI 2H 2H 2H 2H 1H TMS Expansion of peak near 128.5 ppm 2 peaks CDCI, TMS 200 190 180 170 160 150 140 130 120 110 100 90 80 70 60 50 40 30 20 100 a. (3 pts.) What is the DoU? b. (4 pts.) The mass spectrum shows a signal for M . at m/z : 210 (100%)...
Directly compare your own GCMS data to the three different stock GCMS data sets. CIGC Yukki...
 Directly compare your own GCMS data to the three different
stock GCMS data sets.
CIGC Yukki 7 10000 3.488 Spoctrum 102030405060为80 90 100 110 120 10 140 150 160 170 180 190 Spectrum Peak Repet TIC Area Ast 28a86 100 4.118 Page 1 of 3 10 20 30 40 60 Prak Repon TIC Are Anat 2 4117 Page 2 of 3 TIC 1.00 min Spectnan 0 10 20 0 70300 10 120 140 150 160 170 10 190 Spectrum 0...
Directly compare your own GCMS data to the three different
stock GCMS data sets.
CIGC Yukki 7 10000 3.488 Spoctrum 102030405060为80 90 100 110 120 10 140 150 160 170 180 190 Spectrum Peak Repet TIC Area Ast 28a86 100 4.118 Page 1 of 3 10 20 30 40 60 Prak Repon TIC Are Anat 2 4117 Page 2 of 3 TIC 1.00 min Spectnan 0 10 20 0 70300 10 120 140 150 160 170 10 190 Spectrum 0...
Please answer questions 2,3, and 4 that correspond to the nmr spectra of (2E,6E)-2,6-dibenzylidenecyclohexanone. Product: ppm...
 Please answer questions 2,3, and 4 that correspond to the nmr
spectra of (2E,6E)-2,6-dibenzylidenecyclohexanone.
Product:
ppm BE 06 135 94 190 180 170 160 150 140 130 120 110 100 90 80 70 60 50 40 ppm 30 20 2. Are there any non-aromatic or non-alkene protons seen on the 'H NMR spectrum (yes or no)? If so, list the corresponding ppm value(s): 3. Are there any peaks upfield of 70 ppm seen in the 13C NMR spectrum (yes or...
Please answer questions 2,3, and 4 that correspond to the nmr
spectra of (2E,6E)-2,6-dibenzylidenecyclohexanone.
Product:
ppm BE 06 135 94 190 180 170 160 150 140 130 120 110 100 90 80 70 60 50 40 ppm 30 20 2. Are there any non-aromatic or non-alkene protons seen on the 'H NMR spectrum (yes or no)? If so, list the corresponding ppm value(s): 3. Are there any peaks upfield of 70 ppm seen in the 13C NMR spectrum (yes or...
HELP! Description: Here we have CNMR, HNMR and IR spectra that can be used to identify...
 HELP!
Description: Here we have CNMR, HNMR and IR spectra that can be
used to identify an unknown compound. There is also a description
of the compound in the last picture. I would like to have some help
with the identification of this compound, and the structure of it.
All the information needed is listed below. Thanks!!!!!!
The first picture: IR-spectroscopy data
Second picture: CNMR data
Third picture: HNMR data
IR-SPECTROSCOPY
CNMR
HNMR
42,7 3600,0 3200 2800 2400 2000 1800...
HELP!
Description: Here we have CNMR, HNMR and IR spectra that can be
used to identify an unknown compound. There is also a description
of the compound in the last picture. I would like to have some help
with the identification of this compound, and the structure of it.
All the information needed is listed below. Thanks!!!!!!
The first picture: IR-spectroscopy data
Second picture: CNMR data
Third picture: HNMR data
IR-SPECTROSCOPY
CNMR
HNMR
42,7 3600,0 3200 2800 2400 2000 1800...
this is sec phenethyl alcohol, the nambers in this spectrum represent which structures? eg 77 is...
 this is sec phenethyl alcohol, the nambers in this spectrum
represent which structures? eg 77 is arene. what other numbers
are?
Spe Link: R.Time:7.04Scan:3138) MassPeaks: 114 Raw Mode: Averaged 70-7.003137-3139) BasePeak. 91(516216) BG Mode Cale from Peak Group 1 - Event 100- so 8x12:96 26 30 40 50 60 70 80 90 100 110 120 130 140 150 160 170 180 190 200 mz
this is sec phenethyl alcohol, the nambers in this spectrum
represent which structures? eg 77 is arene. what other numbers
are?
Spe Link: R.Time:7.04Scan:3138) MassPeaks: 114 Raw Mode: Averaged 70-7.003137-3139) BasePeak. 91(516216) BG Mode Cale from Peak Group 1 - Event 100- so 8x12:96 26 30 40 50 60 70 80 90 100 110 120 130 140 150 160 170 180 190 200 mz
 8. (10 points) The following spectra correspond to compounds AE listed below con pound to its corresponding spestre Label very simal on the spectrum (as Co . ctc.). Spectrum CDCI, 190 160 170 160 150 140 130 120 110 100 80 80 Spectrum 2 70 80 50 40 30 20 10 O le CDCI, 190 180 170 180 150 140 130 120 110 100 90 80 70 60 50 40 30 20 10 O de CDCI, 190 180 170 180...
 Suggest a composition for the halogen compound whose mass
spectrum is shown below and assign the labeled peaks.
127 100 173 160 158 162 25 48 TITTHTT 160 170 91 208 79 35 160 173 30 40 50 60 70 80 90 100 110 120 130 140 150 160 170 180 190 200 210 m/z
127 100 173 160 158 162 25 48 TITTHTT 160 170 91 208 79 35 160 173 30 40 50 60 70 80 90 100...
Suggest a composition for the halogen compound whose mass
spectrum is shown below and assign the labeled peaks.
127 100 173 160 158 162 25 48 TITTHTT 160 170 91 208 79 35 160 173 30 40 50 60 70 80 90 100 110 120 130 140 150 160 170 180 190 200 210 m/z
127 100 173 160 158 162 25 48 TITTHTT 160 170 91 208 79 35 160 173 30 40 50 60 70 80 90 100...
 label the spectrum
OTBS Meo Yome Me H NMR spectrum (CDC13, 400 MHz) 8.5 8.0 7.5 7.0 6.5 6.0 5.5 5.0 4.5 4.0 f1 (ppm) 3.5 3.0 2.5 2.0 1.5 1.0 0.5 0.0 -0.5 18C NMR spectrum (CDCI, 100 MHz) 210 200 190 180 170 160 150 140 130 120 110 100 fi (ppm) 90 80 70 60 50 40 30 20 10 -10
label the spectrum
OTBS Meo Yome Me H NMR spectrum (CDC13, 400 MHz) 8.5 8.0 7.5 7.0 6.5 6.0 5.5 5.0 4.5 4.0 f1 (ppm) 3.5 3.0 2.5 2.0 1.5 1.0 0.5 0.0 -0.5 18C NMR spectrum (CDCI, 100 MHz) 210 200 190 180 170 160 150 140 130 120 110 100 fi (ppm) 90 80 70 60 50 40 30 20 10 -10
 Use the mass spectrum and either the NMR spectrum or the IR
spectrum to deduce the structure of the following compound
(c) C8HO3H NMR, 300 MHz, 6.1 ppm (singlet, 2H), 6.9 ppm (doublet, 1H), and 7.3 ppm (singlet, 1H), 7.4 ppm (doublet, 1H), 9.8 ppm (singlet, 1H); significant IR absorbances at 1687, 1602, 1449, 1264, 1038, 929, and 815 cm1. 100 149 (150) 80 60 40 121 63 20 65 91 0 15 20 25 30 35 40 45 50...
Use the mass spectrum and either the NMR spectrum or the IR
spectrum to deduce the structure of the following compound
(c) C8HO3H NMR, 300 MHz, 6.1 ppm (singlet, 2H), 6.9 ppm (doublet, 1H), and 7.3 ppm (singlet, 1H), 7.4 ppm (doublet, 1H), 9.8 ppm (singlet, 1H); significant IR absorbances at 1687, 1602, 1449, 1264, 1038, 929, and 815 cm1. 100 149 (150) 80 60 40 121 63 20 65 91 0 15 20 25 30 35 40 45 50...
 assinments of cnmr of styrene oxide
ppm 140 — 137.598 130 128.476 128.155 --125.472 120 10 13C NMR spectrum (100 MHz CDCI) 100 90 80 77.363 77.045 -76.727 70 60 52.334 -51.164 50 40 30 20 10 6
assinments of cnmr of styrene oxide
ppm 140 — 137.598 130 128.476 128.155 --125.472 120 10 13C NMR spectrum (100 MHz CDCI) 100 90 80 77.363 77.045 -76.727 70 60 52.334 -51.164 50 40 30 20 10 6
 the compound. Trspectaldaa toanswer the following questions and deduce the structure of compound has molecular formula C1zH sCIO. 6H CDCI 2H 2H 2H 2H 1H TMS Expansion of peak near 128.5 ppm 2 peaks CDCI, TMS 200 190 180 170 160 150 140 130 120 110 100 90 80 70 60 50 40 30 20 100 a. (3 pts.) What is the DoU? b. (4 pts.) The mass spectrum shows a signal for M . at m/z : 210 (100%)...
 Directly compare your own GCMS data to the three different
stock GCMS data sets.
CIGC Yukki 7 10000 3.488 Spoctrum 102030405060为80 90 100 110 120 10 140 150 160 170 180 190 Spectrum Peak Repet TIC Area Ast 28a86 100 4.118 Page 1 of 3 10 20 30 40 60 Prak Repon TIC Are Anat 2 4117 Page 2 of 3 TIC 1.00 min Spectnan 0 10 20 0 70300 10 120 140 150 160 170 10 190 Spectrum 0...
Directly compare your own GCMS data to the three different
stock GCMS data sets.
CIGC Yukki 7 10000 3.488 Spoctrum 102030405060为80 90 100 110 120 10 140 150 160 170 180 190 Spectrum Peak Repet TIC Area Ast 28a86 100 4.118 Page 1 of 3 10 20 30 40 60 Prak Repon TIC Are Anat 2 4117 Page 2 of 3 TIC 1.00 min Spectnan 0 10 20 0 70300 10 120 140 150 160 170 10 190 Spectrum 0...
 Please answer questions 2,3, and 4 that correspond to the nmr
spectra of (2E,6E)-2,6-dibenzylidenecyclohexanone.
Product:
ppm BE 06 135 94 190 180 170 160 150 140 130 120 110 100 90 80 70 60 50 40 ppm 30 20 2. Are there any non-aromatic or non-alkene protons seen on the 'H NMR spectrum (yes or no)? If so, list the corresponding ppm value(s): 3. Are there any peaks upfield of 70 ppm seen in the 13C NMR spectrum (yes or...
Please answer questions 2,3, and 4 that correspond to the nmr
spectra of (2E,6E)-2,6-dibenzylidenecyclohexanone.
Product:
ppm BE 06 135 94 190 180 170 160 150 140 130 120 110 100 90 80 70 60 50 40 ppm 30 20 2. Are there any non-aromatic or non-alkene protons seen on the 'H NMR spectrum (yes or no)? If so, list the corresponding ppm value(s): 3. Are there any peaks upfield of 70 ppm seen in the 13C NMR spectrum (yes or...
 HELP!
Description: Here we have CNMR, HNMR and IR spectra that can be
used to identify an unknown compound. There is also a description
of the compound in the last picture. I would like to have some help
with the identification of this compound, and the structure of it.
All the information needed is listed below. Thanks!!!!!!
The first picture: IR-spectroscopy data
Second picture: CNMR data
Third picture: HNMR data
IR-SPECTROSCOPY
CNMR
HNMR
42,7 3600,0 3200 2800 2400 2000 1800...
HELP!
Description: Here we have CNMR, HNMR and IR spectra that can be
used to identify an unknown compound. There is also a description
of the compound in the last picture. I would like to have some help
with the identification of this compound, and the structure of it.
All the information needed is listed below. Thanks!!!!!!
The first picture: IR-spectroscopy data
Second picture: CNMR data
Third picture: HNMR data
IR-SPECTROSCOPY
CNMR
HNMR
42,7 3600,0 3200 2800 2400 2000 1800...
 this is sec phenethyl alcohol, the nambers in this spectrum
represent which structures? eg 77 is arene. what other numbers
are?
Spe Link: R.Time:7.04Scan:3138) MassPeaks: 114 Raw Mode: Averaged 70-7.003137-3139) BasePeak. 91(516216) BG Mode Cale from Peak Group 1 - Event 100- so 8x12:96 26 30 40 50 60 70 80 90 100 110 120 130 140 150 160 170 180 190 200 mz
this is sec phenethyl alcohol, the nambers in this spectrum
represent which structures? eg 77 is arene. what other numbers
are?
Spe Link: R.Time:7.04Scan:3138) MassPeaks: 114 Raw Mode: Averaged 70-7.003137-3139) BasePeak. 91(516216) BG Mode Cale from Peak Group 1 - Event 100- so 8x12:96 26 30 40 50 60 70 80 90 100 110 120 130 140 150 160 170 180 190 200 mz
Most questions answered within 3 hours.
-
The free energy change for the following reaction at 25 °C, when
[Sn2+] = 1.17 M...
asked 1 hour ago -
An MNE is this kind of industry when competition in one country
is essentially independent of...
asked 2 hours ago -
. For this set of questions, determine what
proportion of a normal distribution is located betweeneach...
asked 3 hours ago -
A college student is employed as a door-to-door newspaper
salesman. Historical data suggests that the student...
asked 4 hours ago -
MATLAB HW 11 problem using Switch Case and Input commands
Write a script file that calculates...
asked 4 hours ago -
Considering gravitational time dilation, calculate the time that
passes in Earth’s surface while 1 hour passes...
asked 4 hours ago -
Minitab Problem: Take the Lake Hume June rainfall data and find
use the processes outlined in...
asked 5 hours ago -
X Company is trying to decide whether to continue using old
equipment to make Product A...
asked 5 hours ago -
IN PYTHON ONLY !! Program 2: Re-work
program #5 (WeeklyHours) from the previous assignment such that...
asked 6 hours ago -
The average length of time between arrivals at a turnpike
toll-booth is 26 seconds. What is...
asked 7 hours ago -
(a) A piston at 6.1 atm contains a gas that occupies a volume of
3.5 L....
asked 9 hours ago -
Please answer true or false. Words
cannot be changed or added in to make it true...
asked 9 hours ago