Assume: Demand Curve: QD = 80 – 10P; and Supply Curve: QS = 10P 7. Given...
Assume: Demand Curve: QD = 80 – 10P; and Supply Curve: QS = 10P 7. Given the information derived above, identify on the graph consumer surplus and producer surplus for each situation as well as deadweight loss, if any. d. Government imposes a sales tax of $4.00, which is equally split between consumers and producers. What is the total surplus? Is the market operating efficiently? INCLUDE A GRAPH
Homework Answers
7. Consumer surplus = area between the demand curve and price line = shown by yellow shaded region. Producer surplus = area between the supply curve and price line = shown by green shaded region. There is no deadweight loss before tax.

d. Government imposes a sales tax of $4.00, which is equally split between consumers and producers. Now the equilibrium price has risen to $6 and quantity has reduced to 20 units. Consumer surplus and producer surplus are reduced now. There is a government revenue from tax and there is a deadweight loss as well.
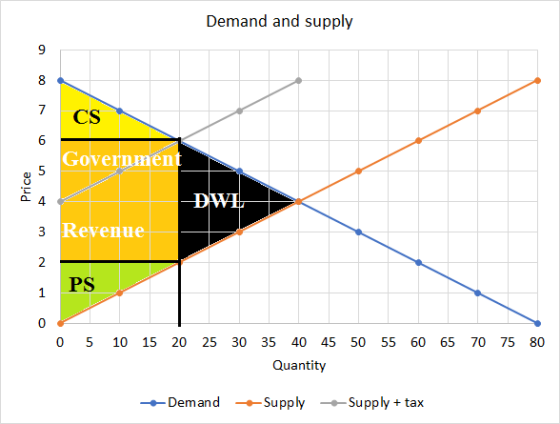
After tax supply becomes Q = 10(P - 4) or Q = 10P - 40
New equilibrium has
10P - 40 = 80 - 10P
P = 120/20 = $6 and Q = 80 - 60 = 20 units
Producers receive $6 - $4 = $2 as the after tax price
Total surplus = 0.5*(8 - 6)*20 + 0.5*(2 - 0)*20 + (6 - 2)*20 = $120
Market is not efficient since there is a deadweight loss now = 0.5*4*(40 - 20) = $40.
Add Answer to:
Assume: Demand Curve: QD = 80 – 10P; and Supply Curve: QS = 10P
7. Given...
Assume: Demand Curve: QD = 80 – 10P; and Supply Curve: QS = 10P 7. Given...
Assume: Demand Curve: QD = 80 – 10P; and Supply Curve: QS = 10P 7. Given the information derived above, identify on the graph consumer surplus and producer surplus for each situation as well as deadweight loss, if any. b. Government imposes a minimum price of $6.00 Calculate and assess (describe the impact) of the following: 1. Consumer Surplus 2. Producer Surplus 3. Deadweight Loss 4. Total Surplus 5. Government Revenue 6. Is the market operating efficiently: Yes or No....
Assume: Demand Curve: QD = 80 – 10P; and Supply Curve: QS = 10P 7. Given...
Assume: Demand Curve: QD = 80 – 10P; and Supply Curve: QS = 10P 7. Given the information derived above, identify on the graph consumer surplus and producer surplus for each situation as well as deadweight loss, if any. INCLUDE A GRPAH c. Government imposes a maximum price of $2.00. INCLUDE A GRAPH
Assume: Demand Curve: QD = 80 – 10P; and Supply Curve: QS = 10P 7. Given...
Assume: Demand Curve: QD = 80 – 10P; and Supply Curve: QS = 10P 7. Given the information derived above, identify on the graph consumer surplus and producer surplus for each situation as well as deadweight loss, if any, total surplus and quantify the quantity of goods imported. e. now assume a world price of $2.00. INCLUDE A GRAPH
Assume: Demand Curve: QD = 80 – 10P; and Supply Curve: QS = 10P 7. Given...
Assume: Demand Curve: QD = 80 – 10P; and Supply Curve: QS = 10P 7. Given the information derived above, identify on the graph consumer surplus and producer surplus for each situation as well as deadweight loss, if any. What is the total surplus? Quantify the quantity of goods imported. describe the implications of the imposition of a tariff in this market F. now assume a tariff of $1.00 is added to the world price of $2.00. INCLUDE A GRAPH
Suppose that the demand curve for wheat is Qd= 400-10p Qs= 10p The government provides producers with a specific subsidy...
Suppose that the demand curve for wheat is Qd= 400-10p Qs= 10p The government provides producers with a specific subsidy of S=$11 per unit. How do the equilibrium price and quantity change? The equilibrium price by $_______ and the equilibrium quantity by $_______ units. (Enter numeric responses using real numbers rounded to two decimal places.) What effect does this tax (subsidy) have on consumer surplus, producer surplus, government revenue, welfare, and deadweight loss? Consumer surplus (increase or decrease) by $...
Consider the market for oranges. The supply curve is QS=-20 +10P The demand curve is Qd...
Consider the market for oranges. The supply curve is QS=-20 +10P The demand curve is Qd =100-10P Find the Equilibrium price. Find the equilibrium quantity Draw a rough sketch of your curves and depict the equilibrium What will be the outcome if the government fixes the price at $5.00 what will be the outcome? Calculate the consumers’ and producers’ surplus at the equilibrium price.
Suppose that the demand curve for organic tomatoes is Q = 120-10p, and the supply curve...
Suppose that the demand curve for organic tomatoes is Q = 120-10p, and the supply curve is Q=10p. The government imposes a price control of p = 4. (a) Without government intervention, what is the equilibrium price and quantity? (b) Without government intervention, what is the consumer surplus, producer surplus, and deadweight loss? Use a graph in your calculations. (c) Is the price control a price ceiling or price floor? Why? With the price control, what is the new equilibrium...
Suppose that demand and supply functions for good X are: QD=90-10P (P=9-0.1QD) QS=20P-6 (P=0.3+0.05QS) a. Graph...
Suppose that demand and supply functions for good X are: QD=90-10P (P=9-0.1QD) QS=20P-6 (P=0.3+0.05QS) a. Graph this situation. b. What is the equilibrium price and quantity in the market for good X? c. What is consumers surplus? Producers surplus? d. Suppose the government imposes a per unit tax on good X equal to 1 dollar (per unit). What is the new equilibrium price and quantity? How much revenue would this tax raise for the government? What is consumers surplus? Producers...
The supply and demand for 9-volt batteries are given by QD = 230 – 10P and...
The supply and demand for 9-volt batteries are given by QD = 230 – 10P and QS = 30P – 10, where P is the price per four-pack and Q measures the number of four-packs. a. What are the levels of consumer and producer surplus at the equilibrium price? b. Suppose that a hurricane causes widespread blackouts, shifting the demand curve for 9-volt batteries outward, with the new demand curve equal to QD = 690 – 10P. If the government...
Suppose market demand for bread is given by the equation QD = 12-P while the market...
 Suppose market demand for bread is given by the equation QD = 12-P while the market supply equation is Qs = 2P. a. Calculate the equilibrium price and quantity, consumer surplus, and producer surplus in the market for tires. Graph your results. b. Suppose the government imposes a tax on tire producers of $3 per tire. i. What price will the buyer pay? What is the burden to consumers? What amount per unit will the seller receive? What is the...
 Suppose market demand for bread is given by the equation QD = 12-P while the market supply equation is Qs = 2P. a. Calculate the equilibrium price and quantity, consumer surplus, and producer surplus in the market for tires. Graph your results. b. Suppose the government imposes a tax on tire producers of $3 per tire. i. What price will the buyer pay? What is the burden to consumers? What amount per unit will the seller receive? What is the...
Most questions answered within 3 hours.
-
Java Please
Source Only
Program 2: All Hail Modulus Agustus! The modulus operator is
used all...
asked 12 minutes ago -
What is the limiting reagent in a reaction of 12g of Sodium
chloride and 23g of...
asked 13 minutes ago -
Illustrate and explain using diagrams, the difference between
long run supply in a constant cost individual...
asked 10 minutes ago -
The
following items are taken from the annual financial statements of
Opco Company at December 31,...
asked 16 minutes ago -
Write a c++ program that shows the 10 employees record which is
not allowed to be...
asked 19 minutes ago -
The team of psychologists suggested that the type of instruction
should match with...?
asked 20 minutes ago -
Prepare a MARIE program to encode your full name using Unicode /
ASCII characters. You should...
asked 25 minutes ago -
To make bond purchases, the Fed gets the money __________.
Select the correct answer below:
exclusively...
asked 20 minutes ago -
Three masses of mass M=1.2kg are initially located at
positions:
r1→=4.0m i+2.8m j −4.4mk
r2→=5.4m i+1.0m...
asked 46 minutes ago -
List and briefly describe the three types of thermoelectric
sensors.
asked 46 minutes ago -
A bond has a $1,000 par value, 20 years to maturity and a 5%
annual coupon...
asked 47 minutes ago -
The three key cash-related activities of a firm are
operational activities, non-current activities and financing
activities....
asked 4 hours ago