
Homework Answers
Answer 1(a) :

Answer 1(b) :
Answer 1( c) : As we can see in Figure 1 , the X axis represents the Quantity of Dollar in the market and the Y axis represents the Exchange rate. Here D1D2 is the market demand of dollar and S1S2 is the supply of dollar. Point M is the point of equilibrium in the market, where the supply and demand curves meet. Now, if the US Government levies a hike in the income tax, this will reduce the amount of available dollars at the hands of the people. The reduction of dollar in the hand of the people will reduce the supply of dollar in the market. Here the S1S2 curve shifts down to the S3S4 curve. When there is a reduction in the supply of dollar, the value of dollar increases which reduces the demand for Dollar in the market. Hence the equilibrium level also drops down to MMx from MM.
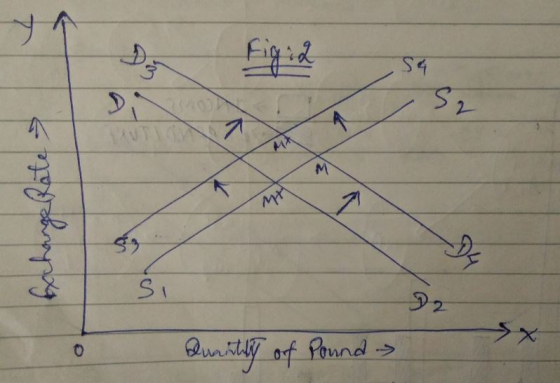
Similarly, we can see in Figure 2 , the X axis represents the Quantity of Pound in the market and the Y axis represents the Exchange rate. Here D1D2 is the market demand of pound and S1S2 is the supply of pound. Point M is the point of equilibrium in the market, where the supply and demand curves meet. Now, if the UK Government levies a cut in the income tax, this will increase the number of available pounds at the hands of the people. The increase of pound in the hand of the people will reduce the increase of pound in the market. Here the S1S2 curve shifts up to the S3S4 curve. When there is an increase in the supply of pound, the value of pound decreases which increases the demand for pound in the market. Hence the equilibrium level also moves up to MMx from MM.
Answer 2(a) :

Answer 2(b) : As we can see in Figure 3 , the X axis represents the Quantity of Rubel in the market and the Y axis represents the Exchange rate. Here D1D2 is the market demand of Rubel and S1S2 is the supply of Rubel. Point M is the point of equilibrium in the market, where the supply and demand curves meet. The value of Rubel is so over-priced in the economy that a forced equilibrium M is achieved at a very low supply and demand of the Ruble in the market. In order to improve the situation and to defend the price of the Rubel in the market, the policy makers can cut down the tax rates in the economy and additionally invest huge amount of Rubel in the various economic sectors. The ax rate cut and influx of investment from the Government will increase the availability of Rubel in the hands of people, thereby devaluing the Rubel, and increasing the demand for Rubel in the market. This increase of the demand for Rubel will shift the economic equilibrium at Mx which will increase both the supply and the demand for Rubel in the economy.
Add Answer to:
1.) The Dollar and the Pound. a.) Draw a market where the dollar is in equilibrium....
Assume that initially the pound/dollar FX market is in equilibrium. The current spot rate is 0.75...
Assume that initially the pound/dollar FX market is in equilibrium. The current spot rate is 0.75 pounds per USD, EL/$=0.75. Interest rate on pound deposit in London is 0.5%, while the interest rate on USD deposit in New York is 1.5%. The expected future exchange rate is EeL/$=0.7425. Then, Bank of England announces a 25 basis points increase in UK interest rates (0.25 percentage points). What is the new equilibrium spot exchange rate?
1. Labour Market. Draw a diagram of the labour market where there above the equilibrium level....
 1. Labour Market. Draw a diagram of the labour market where there above the equilibrium level. Use I to denote the amount of labour to denote the amount of labour hired. bour market where the real wage is stuck note the amount of labour willing to work and L1 Now suppose there is an increase in technology that raises the demand the new demand curve and explain what happens to the and curve and explain what happens to the number...
Price (S/pound) The graph to the right shows the competitive equilibrium in the domestic cotton market...
 Price (S/pound) The graph to the right shows the competitive equilibrium in the domestic cotton market in autarky (no trade). Suppose the world price of cotton is $7 per pound, and assume that the United States can buy as much imported cotton as it wants at the world price. Now suppose that the U.S. allows the free trade of cotton. 1.) Using the line drawing tool, indicate the world price of cotton and label it Pw 2.) Using the point...
(1) Consider the situation below how it might affect the US market interest rate. (2) Draw...
(1) Consider the situation below how it might affect the US market interest rate. (2) Draw a demand and supply for money as part of your answer (3) Explain briefly on your graph and reasoning. Government expenditures are supported by tax income or borrowing. The government has increased the debt ceiling over time and this year the government decided to increase individual income tax instead. How might this decision affect the US market interest rate from the household perspective only.
C. what happens to the market equilibrium price and quantity exchanged if there is a reduction...
 C. what happens to the market equilibrium price and quantity exchanged if there is a reduction in supply (leftward shift in the market supply curve). Explain your answer. A. Draw a demand and supply curve for a physician office visits where there is no insurance coverage. Indicate the equilibrium price and quantity of office visits in the market. 2. B. On your diagram above, draw in the market demand curve where there is a 50% coninsurance rate (assume everyone has...
kindly do it as written form on word 1 Market Equilibrium [60 marks] Suppose the demand...
kindly do it as written form on word 1 Market Equilibrium [60 marks] Suppose the demand and supply relations of wheat in an economy are given by: D: Q = 1500 − 6P + aY S: Q = −270 + 9P where Q denotes the quantity of wheat measured in million of bushels per year, P is the price of wheat measured in thousand of £ per million bushels; Y is average income measured in thousand £ per year....
Assume that the UK car market is perfectly competitive and that cars are a homogenous good....
Assume that the UK car market is perfectly competitive and that cars are a homogenous good. The inverse demand curve for cars is given by PD(Q) = 36−Q, where quantities are measured in millions of units, while prices are measured in thousands of dollars. The supply of cars in the US is given by PS(Q) = 6 + 2Q. Cars are produced also in other countries and in this exercise we will assume that the US is “small” as far...
DEMAND. SUPPLY, AND MARKET EQUILIBRIUM KEY TERMS change in demand change in quantity demanded change in...
 DEMAND. SUPPLY, AND MARKET EQUILIBRIUM KEY TERMS change in demand change in quantity demanded change in quantity supplied change in supply complements demand schedule excess demand (shortage) excess supply (surplus) individual demand curve Individual supply curve Inferior good law of demand law of supply market demand curve market equilibrium market supply curve minimum supply price normal good perfectly competitive market quantity demanded quantity supplied substitutes supply schedule EXERCISES All problems are assignable in MyEconLab The Demand Curve Describe and explain...
For Questions 1-15, consider a competitive market for a good where the demand curve is determined...
For Questions 1-15, consider a competitive market for a good where the demand curve is determined by: the demand function: P = 5+-1*Qd and the supply curve is determined by the supply function: P = 0.5*Qs. Where P stands for Price, QD is quantity demanded and QS is quantity supplied. What is the quantity demanded of the good when the price level is P = $4? QUESTION 2 What is the quantity supplied of the good when the price level...
1. In an economy which has a national income identity as the following; Y= C+ I + G + NX where C ...
 I need help with this.
1. In an economy which has a national income identity as the following; Y= C+ I + G + NX where C = 400 + 0.6 Yd,; 1 = 1000-4600 r, G-1240 T-200 +0.25 Y; NX-400-0.05Y-8 00 e ( ofcourse, Yd=Y-T) Where e- foreign currency/ domestic currency, and initially set at e 1.25+2.5R The money demand function is Md- 0.75 Y-7500 r, and money supply is set by the Central Bank at 450. All calculation...
I need help with this.
1. In an economy which has a national income identity as the following; Y= C+ I + G + NX where C = 400 + 0.6 Yd,; 1 = 1000-4600 r, G-1240 T-200 +0.25 Y; NX-400-0.05Y-8 00 e ( ofcourse, Yd=Y-T) Where e- foreign currency/ domestic currency, and initially set at e 1.25+2.5R The money demand function is Md- 0.75 Y-7500 r, and money supply is set by the Central Bank at 450. All calculation...
 1. Labour Market. Draw a diagram of the labour market where there above the equilibrium level. Use I to denote the amount of labour to denote the amount of labour hired. bour market where the real wage is stuck note the amount of labour willing to work and L1 Now suppose there is an increase in technology that raises the demand the new demand curve and explain what happens to the and curve and explain what happens to the number...
 Price (S/pound) The graph to the right shows the competitive equilibrium in the domestic cotton market in autarky (no trade). Suppose the world price of cotton is $7 per pound, and assume that the United States can buy as much imported cotton as it wants at the world price. Now suppose that the U.S. allows the free trade of cotton. 1.) Using the line drawing tool, indicate the world price of cotton and label it Pw 2.) Using the point...
 C. what happens to the market equilibrium price and quantity exchanged if there is a reduction in supply (leftward shift in the market supply curve). Explain your answer. A. Draw a demand and supply curve for a physician office visits where there is no insurance coverage. Indicate the equilibrium price and quantity of office visits in the market. 2. B. On your diagram above, draw in the market demand curve where there is a 50% coninsurance rate (assume everyone has...
 DEMAND. SUPPLY, AND MARKET EQUILIBRIUM KEY TERMS change in demand change in quantity demanded change in quantity supplied change in supply complements demand schedule excess demand (shortage) excess supply (surplus) individual demand curve Individual supply curve Inferior good law of demand law of supply market demand curve market equilibrium market supply curve minimum supply price normal good perfectly competitive market quantity demanded quantity supplied substitutes supply schedule EXERCISES All problems are assignable in MyEconLab The Demand Curve Describe and explain...
 I need help with this.
1. In an economy which has a national income identity as the following; Y= C+ I + G + NX where C = 400 + 0.6 Yd,; 1 = 1000-4600 r, G-1240 T-200 +0.25 Y; NX-400-0.05Y-8 00 e ( ofcourse, Yd=Y-T) Where e- foreign currency/ domestic currency, and initially set at e 1.25+2.5R The money demand function is Md- 0.75 Y-7500 r, and money supply is set by the Central Bank at 450. All calculation...
I need help with this.
1. In an economy which has a national income identity as the following; Y= C+ I + G + NX where C = 400 + 0.6 Yd,; 1 = 1000-4600 r, G-1240 T-200 +0.25 Y; NX-400-0.05Y-8 00 e ( ofcourse, Yd=Y-T) Where e- foreign currency/ domestic currency, and initially set at e 1.25+2.5R The money demand function is Md- 0.75 Y-7500 r, and money supply is set by the Central Bank at 450. All calculation...
Most questions answered within 3 hours.
-
Two noble gases (Ne and He) are injected into the chambers of an
insulated container. Each...
asked 30 seconds from now -
Suppose you purchase a zero coupon bond with a face value of
$1,000, maturing in 18...
asked 4 minutes ago -
Explain how blackbody radiation led to the idea of "quanta."
Will rate answer!
asked 4 minutes ago -
Do you believe that the $785,000 amount at the center of the
Overstock-Grant Thornton dispute was...
asked 5 minutes ago -
Find and , the mean and standard deviation of the
sampling distribution of :
μ = 25,...
asked 29 minutes ago -
According to the manufacturer of a certain candy, 9% of the
candy produced are red. If...
asked 47 minutes ago -
A Eucher Deck consists of 24 cards. In a four- player game, each
player is dealt...
asked 1 hour ago -
This is a challenging question.
The titration of an impure sample of KHP found that 36.00...
asked 1 hour ago -
1. Starting from rest, an automatic subway train is controlled
by a computer
that causes it’s...
asked 29 minutes ago -
You place a block of
ice (mass of 3 kg) into a test chamber filled with...
asked 1 hour ago -
If a benzene ring has one -CF3 group as a
substituent, will the next substituent add...
asked 53 minutes ago -
CORPORATE FINANCE
STATEMENT: If the total risk of a stock is high you can
expect the...
asked 44 minutes ago