

![Complete this question by entering your answers in the tabs below. Req A and B Reg C Reg D Reg E to H ReqI Req] e. If Wipers](http://img.homeworklib.com/questions/83383240-6fac-11ea-bd9f-5d984ce15e2b.png?x-oss-process=image/resize,w_560)

Homework Answers
Solution:
a.) ROI = Net income / Average total assets
| 2020 (in $ and million) | 2019 (in $ and million) | ||
| 1. | Net income | 200 | 195 |
| 2. | Beginning total assets | 2,838 | 2,485 |
| 3. | Ending total assets | 3,099 | 2,838 |
| 4. | Average total assets: | ||
| [(2) +(3)]/2 | $2,968.5 | $2,661.5 | |
| 5. | Return on investment [(1) +(4)] | 6.7% | 7.3% |
b.) Return on equity = Net income / Average stockholder' equity
| 2020(in $ and million) | 2019(in $ and million) | ||
| 1. | Net income | 200 | 195 |
| 2. | Beginning stockholder' equity | 1,029 | 921 |
| 3. | Ending stockholder' equity | 1,010 | 1,029 |
| 4. | Average stockholder' equity | ||
| [(2)+(3)]/2 | 1524.5 | 975 | |
| 5. | Return on equity [(1) /(4)] | 13.1% | 20% |
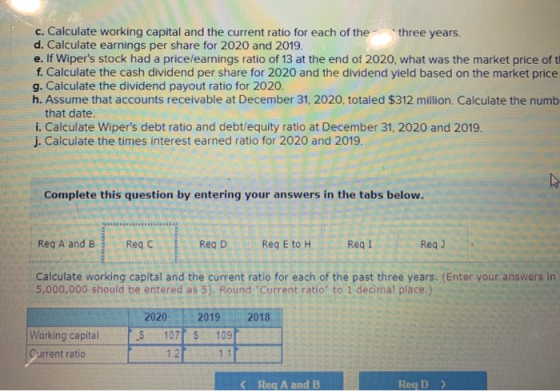
c.) Working capital =current assets - current liabilities
Current ratio =current assets /currentliabilities
| 2020( in$ and million) | 2019(in dollar and million) | 2018 ( in dollar and million) | ||
| 1. | Current assets | 683 | 915 | 763 |
| 2. | Current liabilities | 576 | 806 | 713 |
| 3. | Working capital (1-2) | 107 | 109 | 50 |
| 4. | Current ratio (1/2) | 1.2 | 1.1 | 1.0 |
d.) Earnings per share = Net income /Average number of common shares outstanding
| 2020 (in $ and million) | 2019 (in $ and million) | ||
| 1. | Net income | 200 | 195 |
| 2. | Average number of common | ||
| Shares outstanding | 41.6 | 47.0 | |
| 3. | Earnings per share (1) /(2) | $4.80 | $4.15 |
e.) Market price of the stock = price earning ratio × earning per share
=13 ×$4.80 = $62.4
f.)
| F. | Dividened per share =Total dividends paid / average number of common shares outstanding =53.0/41.6 =$1.27 per share |
| Dividend yield = Dividend per share / market price of the stock =(1.27 /62.4)×100 =2.03% |
g.) Dividend payout ratio = total dividend paid / net income
=53.0/200 =0.27
h.) Number of days sales in receivables = Average accounts receivable / Average daily sales on account
Average daily sales on account = Sales / 365
=$3,053/365 = 8.364
Number of days sales in receivables
=312 /8.364
=37.30
37 days
Add Answer to:
please complete only what is missing as soon as possible and
please use the same format...
please complete the entire question, try and use the same format if possible Presented here are...
 please complete the entire question, try and use the same format if
possible
Presented here are summarized data from the balance sheets and income statements of Wiper Inc.: WIPER INC. Condensed Balance Sheets December 31, 2020, 2019, 2018 (in millions) Current assets Other assets Total assets Current liabilities Long-term liabilities Stockholders' equity Total liabilities and stockholders' equity 2019 $ 915 1,923 $2,838 2018 $ 763 1,722 $2,485 2020 $ 683 2,416 $3,099 $ 576 1,513 1,010 $3,099 715 Current S....
please complete the entire question, try and use the same format if
possible
Presented here are summarized data from the balance sheets and income statements of Wiper Inc.: WIPER INC. Condensed Balance Sheets December 31, 2020, 2019, 2018 (in millions) Current assets Other assets Total assets Current liabilities Long-term liabilities Stockholders' equity Total liabilities and stockholders' equity 2019 $ 915 1,923 $2,838 2018 $ 763 1,722 $2,485 2020 $ 683 2,416 $3,099 $ 576 1,513 1,010 $3,099 715 Current S....
Presented here are summarized data from the balance sheets and income statements of Wiper Inc WIPER...
 Presented here are summarized data from the balance sheets and income statements of Wiper Inc WIPER INC. Condensed Balance Sheets December 31, 2020, 2019, 2018 (in millions) 202e $ 793 2.428 $3,221 $ 592 $ 883 1,734 $2,617 Current assets Other assets Total assets Current liabilities Long-term liabilities Stockholders' equity Total liabilities and stockholders' equity 2019 $1,e21 1,935 $2,956 S845 1,070 1.041 $2,956 1,6e7 1,022 $3,221 WIPER INC. Selected Income Statement and Other Data For the year Ended December 31,...
I want only the wrong questions WIPER INC. Condensed Balance Sheets December 31, 2e2e, 2019, 2018...
 I
want only the wrong questions
WIPER INC. Condensed Balance Sheets December 31, 2e2e, 2019, 2018 (in millions) 2020 Current assets $ 764 Other assets 2,424 Total assets $3,188 Current liabilities $ 588 Long-term liabilities 1,582 Stockholders' equity 1,18 Total liabilities and stockholders' equity $3,188 2019 2018 $981 $ 843 1,931 1,730 $2,912 $2,573 841 5724 1,034 91 1,037 929 $2,912 $2,573 2019 WIPER INC. Selected Income Statement and other Data For the year Ended December 31, 2020 and 2019...
I
want only the wrong questions
WIPER INC. Condensed Balance Sheets December 31, 2e2e, 2019, 2018 (in millions) 2020 Current assets $ 764 Other assets 2,424 Total assets $3,188 Current liabilities $ 588 Long-term liabilities 1,582 Stockholders' equity 1,18 Total liabilities and stockholders' equity $3,188 2019 2018 $981 $ 843 1,931 1,730 $2,912 $2,573 841 5724 1,034 91 1,037 929 $2,912 $2,573 2019 WIPER INC. Selected Income Statement and other Data For the year Ended December 31, 2020 and 2019...
Condensed Balance Sheets December 31, 2020, 2019, 2018 (in millions) 2020 Current assets $ 764 Other assets 2,42...
 Condensed Balance Sheets December 31, 2020, 2019, 2018 (in millions) 2020 Current assets $ 764 Other assets 2,424 Total assets $3,188 Current liabilities $ 588 Long-term liabilities 1,582 Stockholders' equity 1,018 Total liabilities and stockholders' equity $3,188 2019 $ 981 1,931 $2,912 $ 841 1,034 1,037 $2,912 2018 $ 843 1,730 $2,573 $ 734 910 929 $2,573 2019 WIPER INC. Selected Income Statement and Other Data For the year Ended December 31, 2020 and 2019 (in millions) 2020 Income statement...
WIPER INC. Condensed Balance Sheets December 31, 2020, 2019, 2018 (in millions) 2020 2019 2018 $...
 WIPER INC. Condensed Balance Sheets December 31, 2020, 2019, 2018 (in millions) 2020 2019 2018 $ 843 1,730 $2,573 $764 2,424 $ 981 Current assets Other assets 1,931 Total assets $3,188 $2,912 $ 588 $ 841 Current liabilities $ 734 Long-term liabilities Stockholders' equity 1,582 1,018 1,034 1,037 910 929 Total liabilities and stockholders ' equity $2,573 $3,188 $2,912 WIPER INC. Selected Income Statement and Other Data For the year Ended December 31, 2020 and 2019 (in millions) 2020 2019...
please complete the entire question, try and use the same format if possible The following information was availa...
 please complete the entire question, try and use the same format if
possible
The following information was available for the year ended December 31, 2019: Sales Net income Average total assets Average total stockholders' equity Dividends per share Earnings per share Market price per share at year-end $240,000 35,560 540,000 310,000 1.22 3.00 24.30 Required: a. Calculate margin, turnover, and ROI for the year ended December 31, 2019 b. Calculate ROE for the year ended December 31, 2019. c. Calculate...
please complete the entire question, try and use the same format if
possible
The following information was available for the year ended December 31, 2019: Sales Net income Average total assets Average total stockholders' equity Dividends per share Earnings per share Market price per share at year-end $240,000 35,560 540,000 310,000 1.22 3.00 24.30 Required: a. Calculate margin, turnover, and ROI for the year ended December 31, 2019 b. Calculate ROE for the year ended December 31, 2019. c. Calculate...
please show work? Check my Condensed Balance Sheets December 31, 2020, 2019, 2018 (in millions) 2020...
 please show work?
Check my Condensed Balance Sheets December 31, 2020, 2019, 2018 (in millions) 2020 683 2,416 2019 2018 $ 915 s 763 1,722 Current assets $ 1,923 Other assets $2,838 $3,099 $2,485 Total assets $806 1,003 1,029 Current liabilities 576 713 Long-term liabilities Stockholders' equity 1,513 1,010 851 921 $2,485 Total liabilities and stockholders' equity $3,099 $2,838 WIPER INC Selected Income Statement and Other Data For the year Ended December 31, 2020 and 2019 (in millions) 2019 2020...
please show work?
Check my Condensed Balance Sheets December 31, 2020, 2019, 2018 (in millions) 2020 683 2,416 2019 2018 $ 915 s 763 1,722 Current assets $ 1,923 Other assets $2,838 $3,099 $2,485 Total assets $806 1,003 1,029 Current liabilities 576 713 Long-term liabilities Stockholders' equity 1,513 1,010 851 921 $2,485 Total liabilities and stockholders' equity $3,099 $2,838 WIPER INC Selected Income Statement and Other Data For the year Ended December 31, 2020 and 2019 (in millions) 2019 2020...
I neeed the dividened yield Presented here are summarized data from the balance sheets and income...
I neeed the dividened yield Presented here are summarized data from the balance sheets and income statements of Wiper Inc.: WIPER INC. Condensed Balance Sheets December 31, 2020, 2019, 2018 (in millions) 2020 2019 2018 Current assets $ 683 $ 915 $ 763 Other assets 2,416 1,923 1,722 Total assets $ 3,099 $ 2,838 $ 2,485 Current liabilities $ 576 $ 806 $ 713 Long-term liabilities 1,513 1,003 851 Stockholders’ equity 1,010 1,029 921 Total liabilities and stockholders' equity $...
Presented here are summarized data from the balance sheets and income statements of Wiper Inc.: WIPER...
 Presented here are summarized data from the balance sheets and income statements of Wiper Inc.: WIPER INC. Condensed Balance Sheets December 31, 2020, 2019, 2018 (in millions) 2018 2020 2019 773 Current assets 685 917 Other assets 2,417 1,723 1,924 $3,102 $2,841 $2,496 Total assets Current liabilities 816 581 714 Long-term liabilities Stockholders' equity 1,510 1,011 995 860 1,030 922 Total liabilities and stockholders' equity $3,102 $2,841 $2,496 WIPER INC Selected Income Statement and Other Data For the year Ended...
the dividend yield it is not 8.33, 0.02 or 2.27 5 WIPER INC. Condensed Balance Sheets...
 the
dividend yield it is not 8.33, 0.02 or 2.27
5 WIPER INC. Condensed Balance Sheets December 31, 2020, 2019, 2018 (in millions) 2 2020 2019 $ 981 1,931 $2,912 2018 843 1,730 points Current assets $ 764 2,424 Other assets Total assets $3,188 $2,573 Current liabilities Long-term liabilities Stockholders' equity Total liabilities and stockholders' equity $ 588 $ 841 1,034 1,037 $2,912 $ 734 1,582 910 1,018 $3,188 929 $2,573 WIPER INC Selected Income Statement and Other Data For...
the
dividend yield it is not 8.33, 0.02 or 2.27
5 WIPER INC. Condensed Balance Sheets December 31, 2020, 2019, 2018 (in millions) 2 2020 2019 $ 981 1,931 $2,912 2018 843 1,730 points Current assets $ 764 2,424 Other assets Total assets $3,188 $2,573 Current liabilities Long-term liabilities Stockholders' equity Total liabilities and stockholders' equity $ 588 $ 841 1,034 1,037 $2,912 $ 734 1,582 910 1,018 $3,188 929 $2,573 WIPER INC Selected Income Statement and Other Data For...
 please complete the entire question, try and use the same format if
possible
Presented here are summarized data from the balance sheets and income statements of Wiper Inc.: WIPER INC. Condensed Balance Sheets December 31, 2020, 2019, 2018 (in millions) Current assets Other assets Total assets Current liabilities Long-term liabilities Stockholders' equity Total liabilities and stockholders' equity 2019 $ 915 1,923 $2,838 2018 $ 763 1,722 $2,485 2020 $ 683 2,416 $3,099 $ 576 1,513 1,010 $3,099 715 Current S....
please complete the entire question, try and use the same format if
possible
Presented here are summarized data from the balance sheets and income statements of Wiper Inc.: WIPER INC. Condensed Balance Sheets December 31, 2020, 2019, 2018 (in millions) Current assets Other assets Total assets Current liabilities Long-term liabilities Stockholders' equity Total liabilities and stockholders' equity 2019 $ 915 1,923 $2,838 2018 $ 763 1,722 $2,485 2020 $ 683 2,416 $3,099 $ 576 1,513 1,010 $3,099 715 Current S....
 Presented here are summarized data from the balance sheets and income statements of Wiper Inc WIPER INC. Condensed Balance Sheets December 31, 2020, 2019, 2018 (in millions) 202e $ 793 2.428 $3,221 $ 592 $ 883 1,734 $2,617 Current assets Other assets Total assets Current liabilities Long-term liabilities Stockholders' equity Total liabilities and stockholders' equity 2019 $1,e21 1,935 $2,956 S845 1,070 1.041 $2,956 1,6e7 1,022 $3,221 WIPER INC. Selected Income Statement and Other Data For the year Ended December 31,...
 I
want only the wrong questions
WIPER INC. Condensed Balance Sheets December 31, 2e2e, 2019, 2018 (in millions) 2020 Current assets $ 764 Other assets 2,424 Total assets $3,188 Current liabilities $ 588 Long-term liabilities 1,582 Stockholders' equity 1,18 Total liabilities and stockholders' equity $3,188 2019 2018 $981 $ 843 1,931 1,730 $2,912 $2,573 841 5724 1,034 91 1,037 929 $2,912 $2,573 2019 WIPER INC. Selected Income Statement and other Data For the year Ended December 31, 2020 and 2019...
I
want only the wrong questions
WIPER INC. Condensed Balance Sheets December 31, 2e2e, 2019, 2018 (in millions) 2020 Current assets $ 764 Other assets 2,424 Total assets $3,188 Current liabilities $ 588 Long-term liabilities 1,582 Stockholders' equity 1,18 Total liabilities and stockholders' equity $3,188 2019 2018 $981 $ 843 1,931 1,730 $2,912 $2,573 841 5724 1,034 91 1,037 929 $2,912 $2,573 2019 WIPER INC. Selected Income Statement and other Data For the year Ended December 31, 2020 and 2019...
 Condensed Balance Sheets December 31, 2020, 2019, 2018 (in millions) 2020 Current assets $ 764 Other assets 2,424 Total assets $3,188 Current liabilities $ 588 Long-term liabilities 1,582 Stockholders' equity 1,018 Total liabilities and stockholders' equity $3,188 2019 $ 981 1,931 $2,912 $ 841 1,034 1,037 $2,912 2018 $ 843 1,730 $2,573 $ 734 910 929 $2,573 2019 WIPER INC. Selected Income Statement and Other Data For the year Ended December 31, 2020 and 2019 (in millions) 2020 Income statement...
 WIPER INC. Condensed Balance Sheets December 31, 2020, 2019, 2018 (in millions) 2020 2019 2018 $ 843 1,730 $2,573 $764 2,424 $ 981 Current assets Other assets 1,931 Total assets $3,188 $2,912 $ 588 $ 841 Current liabilities $ 734 Long-term liabilities Stockholders' equity 1,582 1,018 1,034 1,037 910 929 Total liabilities and stockholders ' equity $2,573 $3,188 $2,912 WIPER INC. Selected Income Statement and Other Data For the year Ended December 31, 2020 and 2019 (in millions) 2020 2019...
 please complete the entire question, try and use the same format if
possible
The following information was available for the year ended December 31, 2019: Sales Net income Average total assets Average total stockholders' equity Dividends per share Earnings per share Market price per share at year-end $240,000 35,560 540,000 310,000 1.22 3.00 24.30 Required: a. Calculate margin, turnover, and ROI for the year ended December 31, 2019 b. Calculate ROE for the year ended December 31, 2019. c. Calculate...
please complete the entire question, try and use the same format if
possible
The following information was available for the year ended December 31, 2019: Sales Net income Average total assets Average total stockholders' equity Dividends per share Earnings per share Market price per share at year-end $240,000 35,560 540,000 310,000 1.22 3.00 24.30 Required: a. Calculate margin, turnover, and ROI for the year ended December 31, 2019 b. Calculate ROE for the year ended December 31, 2019. c. Calculate...
 please show work?
Check my Condensed Balance Sheets December 31, 2020, 2019, 2018 (in millions) 2020 683 2,416 2019 2018 $ 915 s 763 1,722 Current assets $ 1,923 Other assets $2,838 $3,099 $2,485 Total assets $806 1,003 1,029 Current liabilities 576 713 Long-term liabilities Stockholders' equity 1,513 1,010 851 921 $2,485 Total liabilities and stockholders' equity $3,099 $2,838 WIPER INC Selected Income Statement and Other Data For the year Ended December 31, 2020 and 2019 (in millions) 2019 2020...
please show work?
Check my Condensed Balance Sheets December 31, 2020, 2019, 2018 (in millions) 2020 683 2,416 2019 2018 $ 915 s 763 1,722 Current assets $ 1,923 Other assets $2,838 $3,099 $2,485 Total assets $806 1,003 1,029 Current liabilities 576 713 Long-term liabilities Stockholders' equity 1,513 1,010 851 921 $2,485 Total liabilities and stockholders' equity $3,099 $2,838 WIPER INC Selected Income Statement and Other Data For the year Ended December 31, 2020 and 2019 (in millions) 2019 2020...
 Presented here are summarized data from the balance sheets and income statements of Wiper Inc.: WIPER INC. Condensed Balance Sheets December 31, 2020, 2019, 2018 (in millions) 2018 2020 2019 773 Current assets 685 917 Other assets 2,417 1,723 1,924 $3,102 $2,841 $2,496 Total assets Current liabilities 816 581 714 Long-term liabilities Stockholders' equity 1,510 1,011 995 860 1,030 922 Total liabilities and stockholders' equity $3,102 $2,841 $2,496 WIPER INC Selected Income Statement and Other Data For the year Ended...
 the
dividend yield it is not 8.33, 0.02 or 2.27
5 WIPER INC. Condensed Balance Sheets December 31, 2020, 2019, 2018 (in millions) 2 2020 2019 $ 981 1,931 $2,912 2018 843 1,730 points Current assets $ 764 2,424 Other assets Total assets $3,188 $2,573 Current liabilities Long-term liabilities Stockholders' equity Total liabilities and stockholders' equity $ 588 $ 841 1,034 1,037 $2,912 $ 734 1,582 910 1,018 $3,188 929 $2,573 WIPER INC Selected Income Statement and Other Data For...
the
dividend yield it is not 8.33, 0.02 or 2.27
5 WIPER INC. Condensed Balance Sheets December 31, 2020, 2019, 2018 (in millions) 2 2020 2019 $ 981 1,931 $2,912 2018 843 1,730 points Current assets $ 764 2,424 Other assets Total assets $3,188 $2,573 Current liabilities Long-term liabilities Stockholders' equity Total liabilities and stockholders' equity $ 588 $ 841 1,034 1,037 $2,912 $ 734 1,582 910 1,018 $3,188 929 $2,573 WIPER INC Selected Income Statement and Other Data For...
Most questions answered within 3 hours.
-
The free energy change for the following reaction at 25 °C, when
[Sn2+] = 1.17 M...
asked 1 hour ago -
An MNE is this kind of industry when competition in one country
is essentially independent of...
asked 2 hours ago -
. For this set of questions, determine what
proportion of a normal distribution is located betweeneach...
asked 3 hours ago -
A college student is employed as a door-to-door newspaper
salesman. Historical data suggests that the student...
asked 4 hours ago -
MATLAB HW 11 problem using Switch Case and Input commands
Write a script file that calculates...
asked 3 hours ago -
Considering gravitational time dilation, calculate the time that
passes in Earth’s surface while 1 hour passes...
asked 4 hours ago -
Minitab Problem: Take the Lake Hume June rainfall data and find
use the processes outlined in...
asked 5 hours ago -
X Company is trying to decide whether to continue using old
equipment to make Product A...
asked 5 hours ago -
IN PYTHON ONLY !! Program 2: Re-work
program #5 (WeeklyHours) from the previous assignment such that...
asked 6 hours ago -
The average length of time between arrivals at a turnpike
toll-booth is 26 seconds. What is...
asked 7 hours ago -
(a) A piston at 6.1 atm contains a gas that occupies a volume of
3.5 L....
asked 8 hours ago -
Please answer true or false. Words
cannot be changed or added in to make it true...
asked 8 hours ago