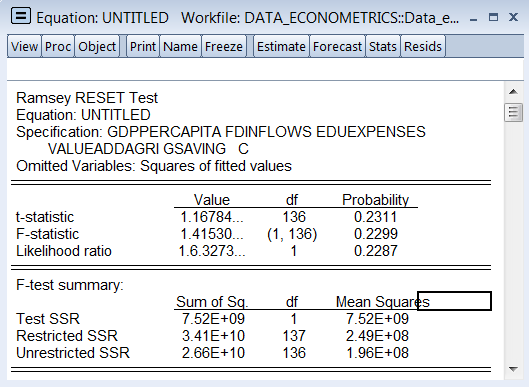
An interpretation for Ramsey test for the below picture
Homework Answers

Add Answer to:
An interpretation for Ramsey test for the below picture
E Equation: UNTITLED Workfile: DATA ECONOMETRICS::Data_e.. X...
An interpretation for Heteroskedasticity for below picture E Equation: UNTITLED Workfile: DATA ECONOMETRICS::Data_e.. View Proc Object...
 An interpretation for Heteroskedasticity for below picture
E Equation: UNTITLED Workfile: DATA ECONOMETRICS::Data_e.. View Proc Object Print Name Freeze Estimate Forecast Stats Resids Heteroskedasticity Test: Breusch-Pagan-Godfrey X F-statistic Obs R-squared Scaled explained SS 5.112724 Prob. F(4,137) 18.44402 Prob. Chi-Square(4) 37.67378 0.0007 0.0010 0.0000 Prob. Chi-Square(4) Test Equation: Dependent Variable: RESID 2 Method: Least Squares Date: 01/19/19 Time: 22:00 Sample: 2 264 Included observations: 142 Variable Coefficient Std. Error t-Statistic Prob 4.54E+08 2.09E+08 2.170543 0.0317 EDUEXPENSES 85458316 30075552 2.841455 0.0052 805579.71666856....
An interpretation for Heteroskedasticity for below picture
E Equation: UNTITLED Workfile: DATA ECONOMETRICS::Data_e.. View Proc Object Print Name Freeze Estimate Forecast Stats Resids Heteroskedasticity Test: Breusch-Pagan-Godfrey X F-statistic Obs R-squared Scaled explained SS 5.112724 Prob. F(4,137) 18.44402 Prob. Chi-Square(4) 37.67378 0.0007 0.0010 0.0000 Prob. Chi-Square(4) Test Equation: Dependent Variable: RESID 2 Method: Least Squares Date: 01/19/19 Time: 22:00 Sample: 2 264 Included observations: 142 Variable Coefficient Std. Error t-Statistic Prob 4.54E+08 2.09E+08 2.170543 0.0317 EDUEXPENSES 85458316 30075552 2.841455 0.0052 805579.71666856....
An interpretation for the picture below Equation: UNTITLED workfile: DATA-ECONOMETRICS:Data-econometrics\ - View Proc Object Print Name...
 An interpretation for the picture below
Equation: UNTITLED workfile: DATA-ECONOMETRICS:Data-econometrics\ - View Proc Object Print Name Freeze Estimate Forecast Stats Resids Series: Residuals Sample 2 264 Observations 142 16 Mean Median Maximum 62287.78 AiRii Std. Dev 15558.97 Skewness 1.387931 Kurtosis5.388834 2.81e-12 3913.582 12 -23534.44 Jarque-Bera 3.354001 Probability 0.294112 20000 -10000 010000 20000 30000 40000 50000 60000
An interpretation for the picture below
Equation: UNTITLED workfile: DATA-ECONOMETRICS:Data-econometrics\ - View Proc Object Print Name Freeze Estimate Forecast Stats Resids Series: Residuals Sample 2 264 Observations 142 16 Mean Median Maximum 62287.78 AiRii Std. Dev 15558.97 Skewness 1.387931 Kurtosis5.388834 2.81e-12 3913.582 12 -23534.44 Jarque-Bera 3.354001 Probability 0.294112 20000 -10000 010000 20000 30000 40000 50000 60000
An interpretation is needed for the below picture E Equation: UNTITLED Workfile: DATA ECONOMETRICS::Data_e.. X View...
 An interpretation is needed for the below picture
E Equation: UNTITLED Workfile: DATA ECONOMETRICS::Data_e.. X View Proc Object Print Name Freeze Estimate Forecast Stats Resids Dependent Variable: GDPPERCAPITA Method: Least Squares Date: 01/19/19 Time: 21:40 Sample (adjusted): 2 264 Included observations: 142 after adjustments Variable Coefficient Std. Error t-Statistic Prob EDUEXPENSES FDINFLOWS GSAVING UNEMPR 3430.904 984.1997 3.485983 0.0007 285.7443 54.60948 5.232504 0.0000 321.8211 135.3456 2.377772 0.0188 557.7184 296.6160 1.880271 0.0622 VALUEADDAGRI 898.3994 133.3089 6.739232 0.0000 4784.332 7670.051 0.623768 0.5338 R-squared...
An interpretation is needed for the below picture
E Equation: UNTITLED Workfile: DATA ECONOMETRICS::Data_e.. X View Proc Object Print Name Freeze Estimate Forecast Stats Resids Dependent Variable: GDPPERCAPITA Method: Least Squares Date: 01/19/19 Time: 21:40 Sample (adjusted): 2 264 Included observations: 142 after adjustments Variable Coefficient Std. Error t-Statistic Prob EDUEXPENSES FDINFLOWS GSAVING UNEMPR 3430.904 984.1997 3.485983 0.0007 285.7443 54.60948 5.232504 0.0000 321.8211 135.3456 2.377772 0.0188 557.7184 296.6160 1.880271 0.0622 VALUEADDAGRI 898.3994 133.3089 6.739232 0.0000 4784.332 7670.051 0.623768 0.5338 R-squared...
An interpretation is needed for the below E Equation: UNTITLED Workfile: DATA ECONOMETRICS::Data_e.. X View Proc...
 An interpretation is needed for the below
E Equation: UNTITLED Workfile: DATA ECONOMETRICS::Data_e.. X View Proc Object Print Name Freeze Estimate Forecast Stats Resids Dependent Variable: GDPPERCAPITA Method: Least Squares Date: 01/19/19 Time: 21:27 Sample (adjusted): 2 264 Included observations: 142 after adjustments Variable Coefficient Std. Error t-Statistic Prob EDUEXPENSES 3409.799982.7287 3.469726 0.0007 60.62503 50.33194 1.204504 0.2305 248.8894 62.51844 3.981056 0.0001 299.3805 136.4002 2.194869 0.0299 529.2544297.0670 1.781599 0.0771 VALUEADDAGRI 840.2738 141.5672 -5.935512 0.0000 2227.235 7946.208 0.280289 0.7797 EXPORTS FDINFLOWS GSAVING...
An interpretation is needed for the below
E Equation: UNTITLED Workfile: DATA ECONOMETRICS::Data_e.. X View Proc Object Print Name Freeze Estimate Forecast Stats Resids Dependent Variable: GDPPERCAPITA Method: Least Squares Date: 01/19/19 Time: 21:27 Sample (adjusted): 2 264 Included observations: 142 after adjustments Variable Coefficient Std. Error t-Statistic Prob EDUEXPENSES 3409.799982.7287 3.469726 0.0007 60.62503 50.33194 1.204504 0.2305 248.8894 62.51844 3.981056 0.0001 299.3805 136.4002 2.194869 0.0299 529.2544297.0670 1.781599 0.0771 VALUEADDAGRI 840.2738 141.5672 -5.935512 0.0000 2227.235 7946.208 0.280289 0.7797 EXPORTS FDINFLOWS GSAVING...
 An interpretation for Heteroskedasticity for below picture
E Equation: UNTITLED Workfile: DATA ECONOMETRICS::Data_e.. View Proc Object Print Name Freeze Estimate Forecast Stats Resids Heteroskedasticity Test: Breusch-Pagan-Godfrey X F-statistic Obs R-squared Scaled explained SS 5.112724 Prob. F(4,137) 18.44402 Prob. Chi-Square(4) 37.67378 0.0007 0.0010 0.0000 Prob. Chi-Square(4) Test Equation: Dependent Variable: RESID 2 Method: Least Squares Date: 01/19/19 Time: 22:00 Sample: 2 264 Included observations: 142 Variable Coefficient Std. Error t-Statistic Prob 4.54E+08 2.09E+08 2.170543 0.0317 EDUEXPENSES 85458316 30075552 2.841455 0.0052 805579.71666856....
An interpretation for Heteroskedasticity for below picture
E Equation: UNTITLED Workfile: DATA ECONOMETRICS::Data_e.. View Proc Object Print Name Freeze Estimate Forecast Stats Resids Heteroskedasticity Test: Breusch-Pagan-Godfrey X F-statistic Obs R-squared Scaled explained SS 5.112724 Prob. F(4,137) 18.44402 Prob. Chi-Square(4) 37.67378 0.0007 0.0010 0.0000 Prob. Chi-Square(4) Test Equation: Dependent Variable: RESID 2 Method: Least Squares Date: 01/19/19 Time: 22:00 Sample: 2 264 Included observations: 142 Variable Coefficient Std. Error t-Statistic Prob 4.54E+08 2.09E+08 2.170543 0.0317 EDUEXPENSES 85458316 30075552 2.841455 0.0052 805579.71666856....
 An interpretation for the picture below
Equation: UNTITLED workfile: DATA-ECONOMETRICS:Data-econometrics\ - View Proc Object Print Name Freeze Estimate Forecast Stats Resids Series: Residuals Sample 2 264 Observations 142 16 Mean Median Maximum 62287.78 AiRii Std. Dev 15558.97 Skewness 1.387931 Kurtosis5.388834 2.81e-12 3913.582 12 -23534.44 Jarque-Bera 3.354001 Probability 0.294112 20000 -10000 010000 20000 30000 40000 50000 60000
An interpretation for the picture below
Equation: UNTITLED workfile: DATA-ECONOMETRICS:Data-econometrics\ - View Proc Object Print Name Freeze Estimate Forecast Stats Resids Series: Residuals Sample 2 264 Observations 142 16 Mean Median Maximum 62287.78 AiRii Std. Dev 15558.97 Skewness 1.387931 Kurtosis5.388834 2.81e-12 3913.582 12 -23534.44 Jarque-Bera 3.354001 Probability 0.294112 20000 -10000 010000 20000 30000 40000 50000 60000
 An interpretation is needed for the below picture
E Equation: UNTITLED Workfile: DATA ECONOMETRICS::Data_e.. X View Proc Object Print Name Freeze Estimate Forecast Stats Resids Dependent Variable: GDPPERCAPITA Method: Least Squares Date: 01/19/19 Time: 21:40 Sample (adjusted): 2 264 Included observations: 142 after adjustments Variable Coefficient Std. Error t-Statistic Prob EDUEXPENSES FDINFLOWS GSAVING UNEMPR 3430.904 984.1997 3.485983 0.0007 285.7443 54.60948 5.232504 0.0000 321.8211 135.3456 2.377772 0.0188 557.7184 296.6160 1.880271 0.0622 VALUEADDAGRI 898.3994 133.3089 6.739232 0.0000 4784.332 7670.051 0.623768 0.5338 R-squared...
An interpretation is needed for the below picture
E Equation: UNTITLED Workfile: DATA ECONOMETRICS::Data_e.. X View Proc Object Print Name Freeze Estimate Forecast Stats Resids Dependent Variable: GDPPERCAPITA Method: Least Squares Date: 01/19/19 Time: 21:40 Sample (adjusted): 2 264 Included observations: 142 after adjustments Variable Coefficient Std. Error t-Statistic Prob EDUEXPENSES FDINFLOWS GSAVING UNEMPR 3430.904 984.1997 3.485983 0.0007 285.7443 54.60948 5.232504 0.0000 321.8211 135.3456 2.377772 0.0188 557.7184 296.6160 1.880271 0.0622 VALUEADDAGRI 898.3994 133.3089 6.739232 0.0000 4784.332 7670.051 0.623768 0.5338 R-squared...
 An interpretation is needed for the below
E Equation: UNTITLED Workfile: DATA ECONOMETRICS::Data_e.. X View Proc Object Print Name Freeze Estimate Forecast Stats Resids Dependent Variable: GDPPERCAPITA Method: Least Squares Date: 01/19/19 Time: 21:27 Sample (adjusted): 2 264 Included observations: 142 after adjustments Variable Coefficient Std. Error t-Statistic Prob EDUEXPENSES 3409.799982.7287 3.469726 0.0007 60.62503 50.33194 1.204504 0.2305 248.8894 62.51844 3.981056 0.0001 299.3805 136.4002 2.194869 0.0299 529.2544297.0670 1.781599 0.0771 VALUEADDAGRI 840.2738 141.5672 -5.935512 0.0000 2227.235 7946.208 0.280289 0.7797 EXPORTS FDINFLOWS GSAVING...
An interpretation is needed for the below
E Equation: UNTITLED Workfile: DATA ECONOMETRICS::Data_e.. X View Proc Object Print Name Freeze Estimate Forecast Stats Resids Dependent Variable: GDPPERCAPITA Method: Least Squares Date: 01/19/19 Time: 21:27 Sample (adjusted): 2 264 Included observations: 142 after adjustments Variable Coefficient Std. Error t-Statistic Prob EDUEXPENSES 3409.799982.7287 3.469726 0.0007 60.62503 50.33194 1.204504 0.2305 248.8894 62.51844 3.981056 0.0001 299.3805 136.4002 2.194869 0.0299 529.2544297.0670 1.781599 0.0771 VALUEADDAGRI 840.2738 141.5672 -5.935512 0.0000 2227.235 7946.208 0.280289 0.7797 EXPORTS FDINFLOWS GSAVING...
Most questions answered within 3 hours.
-
Write a program to solve the Josephus problem, with the following
modification:
Sample Input:
./a.out n...
asked 54 minutes ago -
At the start of a CD it is spinning at a rate of 525 rpm
(revolutions...
asked 1 hour ago -
4. Without doing any calculations, predict whether the observed
∆T would increase, decrease or remain the...
asked 2 hours ago -
Based on the range, which of the following sets of scores has
the greatest variability? 3,...
asked 3 hours ago -
Ripples in a pond travel at a velocity of 3 m/s with one peak
passing a...
asked 3 hours ago -
A man stands on the roof of a building of height 13.0 mm and
throws a...
asked 3 hours ago -
The extent to which assets are financed by borrowed funds and
other liabilities is indicated by:...
asked 4 hours ago -
Explain in detail
Germany is the fifth largest economy
explain what goods and services Germany specializes...
asked 5 hours ago -
The density of platinum is 21.45 g/mL. If a cube of platinum
with a mass of...
asked 5 hours ago -
Accounts Receivable
Sales
A/R Posting
Extended Sales Invoice
Packing Slip
Compare invoice to packing slip 2...
asked 5 hours ago -
Michaella, age 23, is a full-time law student and is claimed by
her parents as a...
asked 5 hours ago -
Why are polymers not typically casted into products?
asked 5 hours ago