The instructor has also asked me for more 'RAW' data but Iam unsure exactly where I would go about finding that and wants at least 10 cases per independant variable and needs a much larger number.
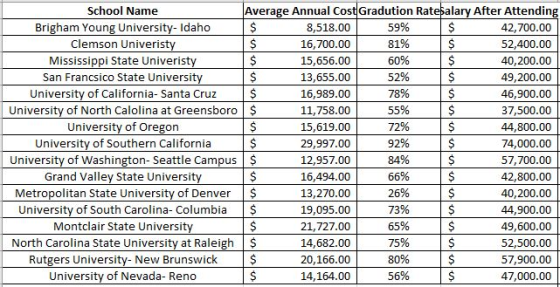
I have attached the regression data that I did via excel. What I am having trouble with is explaining the following:
Where should I look to gather raw data?
What are the major results?
What insights do the graphs provide?
What is the importance of the intercept?
What is the importance of of the 'F'?
My null hypotheses is that the higher cost average annual cost will result in a higher rate of graduation and salary. Would I reject the hypotheses?


Homework Answers


Add Answer to:
The instructor has also asked me for more 'RAW' data but Iam
unsure exactly where I...
Please help with graph, thank you! This is a small business started by Alex Lopez in...
Please help with graph, thank you! This is a small business started by Alex Lopez in 1980. He was 22 years old, and had just graduated from UTSA with a degree in Business. As a young entrepreneur, he bought a greenhouse, and started a hydroponic farm growing tomatoes. Growing various vegetables in water was a new industry at that time. Alex’s business is operating in a perfectly competitive industry, competing with other greenhouse and field producers in the U.S. and...
How do I explain the importance of the intercept? How do I explain the significance of...
 How do I explain the importance of the intercept?
How do I explain the significance of 'F'?
How do I explain the p-value?
My null hypotheses is that the higher cost average annual cost
will result in a higher rate of graduation and salary. Would I
reject the hypotheses?
Average Annual CostGradution Ratealary After Attendin 59% School Name Brigham Young University- Idaho5 8,518.00 16,700.00 15,656.00 13,655.00 16,989.00 Clemson Univeristy 81% 52,400.00 Mississippi State Univeris San Francsico State University University of...
How do I explain the importance of the intercept?
How do I explain the significance of 'F'?
How do I explain the p-value?
My null hypotheses is that the higher cost average annual cost
will result in a higher rate of graduation and salary. Would I
reject the hypotheses?
Average Annual CostGradution Ratealary After Attendin 59% School Name Brigham Young University- Idaho5 8,518.00 16,700.00 15,656.00 13,655.00 16,989.00 Clemson Univeristy 81% 52,400.00 Mississippi State Univeris San Francsico State University University of...
IENG377 Engineering Economy Case Study: Mountaineer Manufacturin You are starting a manufacturing company in Pittsburgh, Pa...
 IENG377 Engineering Economy Case Study: Mountaineer Manufacturin You are starting a manufacturing company in Pittsburgh, Pa Given the following information, what are the projected income statements for this company for the next 5 years? Management/Administration cost: CEO (Your Salary) $150,000 VP Marketing $100,000 VP Sales Chief Technology Officer $100,000 VP Operations $100,000 Other Administration Personnel Salary Combined: 400,000 125,000 Benefits for above personnel: Add 40% of total salary Inflation: Above salaries are for year 1 . These go up by...
The Hard Rock Mining Company is developing cost formulas for management planning and decision-making purposes. The...
 The Hard Rock Mining Company is developing cost formulas for management planning and decision-making purposes. The company's cost analyst has concluded that utilities cost is a mixed cost, and he is attempting to find a base that correlates with the cost. The controller has suggested that tons mined might be a good base to use in developing a cost formula. The production superintendent disagrees; she thinks that direct labor-hours would be a better base. The cost analyst has decided to...
i need help on my retained earnings and income statement. i have a income tax rate...
 i need help on my retained earnings and income statement. i
have a income tax rate of 20% and my RE ending has to be 361,000.
not sure what i am missing on my income statement
here are some updated pictures
We were unable to transcribe this imageWe were unable to transcribe this imageWe were unable to transcribe this image17000 75000 25000 117000 50000 150000 400000 Liabilities and Shareholders' Equity Current Liabilities: Accounts Payable Income Tax Payable t Payable Current...
i need help on my retained earnings and income statement. i
have a income tax rate of 20% and my RE ending has to be 361,000.
not sure what i am missing on my income statement
here are some updated pictures
We were unable to transcribe this imageWe were unable to transcribe this imageWe were unable to transcribe this image17000 75000 25000 117000 50000 150000 400000 Liabilities and Shareholders' Equity Current Liabilities: Accounts Payable Income Tax Payable t Payable Current...
i meed part b andwered PART A Miller Corporation is a manufacturer of precision drill bits....
 i meed part b andwered
PART A Miller Corporation is a manufacturer of precision drill bits. The following information pertains to operations during the 2018 calendar year. Sales Revenue Direct Factory Labor $13.075,000 3.390,600 314,250 Indirect materials used Indirect Factory Labor Total Depreciation Total Utilities2 Distribution & Customer Service Costs 1,232,250 400,000 525,000 67,600 Insurance on Plant & Equipment Property Taxes 3 Administrative Wages & Salaries Advertising Expenses Sales Commission 85,000 90,000 876.500 77.500 6% of Sales Revenue Of the...
i meed part b andwered
PART A Miller Corporation is a manufacturer of precision drill bits. The following information pertains to operations during the 2018 calendar year. Sales Revenue Direct Factory Labor $13.075,000 3.390,600 314,250 Indirect materials used Indirect Factory Labor Total Depreciation Total Utilities2 Distribution & Customer Service Costs 1,232,250 400,000 525,000 67,600 Insurance on Plant & Equipment Property Taxes 3 Administrative Wages & Salaries Advertising Expenses Sales Commission 85,000 90,000 876.500 77.500 6% of Sales Revenue Of the...
I already created the income statement, but now I need the above question answered. Need help...
 I already created the income statement, but now I need the above
question answered. Need help determining how to include the other
costs aside from the labor and material costs.
Walden Company makes and sells wooden furniture. A recent fire destroyed most of the company's accounting record. Mike Lawson, the manager of Walden Company, needs to prepare an income statement for an upcoming meeting with the company's board of directors. Because the key accounts are not usable, Mike asked the...
I already created the income statement, but now I need the above
question answered. Need help determining how to include the other
costs aside from the labor and material costs.
Walden Company makes and sells wooden furniture. A recent fire destroyed most of the company's accounting record. Mike Lawson, the manager of Walden Company, needs to prepare an income statement for an upcoming meeting with the company's board of directors. Because the key accounts are not usable, Mike asked the...
I can't figure iut wbats wrong with the trial balance and t accounts and maybe journal...
 I can't figure iut wbats wrong with the trial balance and t
accounts and maybe journal entries
NAME Financial Accounting Review Problem 1 JOURNALIZE THE FOLLOWING TRANSACTIONS 1. INVESTED $25.000 INTO JHJ SHOESTORE 2. Purchased $6,000 in SUPPLIES on account 3. PURCHASED 3,000 SHOES AT SIO EACH 4. PURCHASED 3,000 SHOES AT $20 EACH 5. Purchased 3,000 Shoes at $30 cach 6. PURCHASED $50,000 IN EQUIPMENT WITH A 5-year LIFE, PAYING $20,000 IN CASH AND PLACED THE REMAINING BALANCE ON...
I can't figure iut wbats wrong with the trial balance and t
accounts and maybe journal entries
NAME Financial Accounting Review Problem 1 JOURNALIZE THE FOLLOWING TRANSACTIONS 1. INVESTED $25.000 INTO JHJ SHOESTORE 2. Purchased $6,000 in SUPPLIES on account 3. PURCHASED 3,000 SHOES AT SIO EACH 4. PURCHASED 3,000 SHOES AT $20 EACH 5. Purchased 3,000 Shoes at $30 cach 6. PURCHASED $50,000 IN EQUIPMENT WITH A 5-year LIFE, PAYING $20,000 IN CASH AND PLACED THE REMAINING BALANCE ON...
 How do I explain the importance of the intercept?
How do I explain the significance of 'F'?
How do I explain the p-value?
My null hypotheses is that the higher cost average annual cost
will result in a higher rate of graduation and salary. Would I
reject the hypotheses?
Average Annual CostGradution Ratealary After Attendin 59% School Name Brigham Young University- Idaho5 8,518.00 16,700.00 15,656.00 13,655.00 16,989.00 Clemson Univeristy 81% 52,400.00 Mississippi State Univeris San Francsico State University University of...
How do I explain the importance of the intercept?
How do I explain the significance of 'F'?
How do I explain the p-value?
My null hypotheses is that the higher cost average annual cost
will result in a higher rate of graduation and salary. Would I
reject the hypotheses?
Average Annual CostGradution Ratealary After Attendin 59% School Name Brigham Young University- Idaho5 8,518.00 16,700.00 15,656.00 13,655.00 16,989.00 Clemson Univeristy 81% 52,400.00 Mississippi State Univeris San Francsico State University University of...
 IENG377 Engineering Economy Case Study: Mountaineer Manufacturin You are starting a manufacturing company in Pittsburgh, Pa Given the following information, what are the projected income statements for this company for the next 5 years? Management/Administration cost: CEO (Your Salary) $150,000 VP Marketing $100,000 VP Sales Chief Technology Officer $100,000 VP Operations $100,000 Other Administration Personnel Salary Combined: 400,000 125,000 Benefits for above personnel: Add 40% of total salary Inflation: Above salaries are for year 1 . These go up by...
 The Hard Rock Mining Company is developing cost formulas for management planning and decision-making purposes. The company's cost analyst has concluded that utilities cost is a mixed cost, and he is attempting to find a base that correlates with the cost. The controller has suggested that tons mined might be a good base to use in developing a cost formula. The production superintendent disagrees; she thinks that direct labor-hours would be a better base. The cost analyst has decided to...
 i need help on my retained earnings and income statement. i
have a income tax rate of 20% and my RE ending has to be 361,000.
not sure what i am missing on my income statement
here are some updated pictures
We were unable to transcribe this imageWe were unable to transcribe this imageWe were unable to transcribe this image17000 75000 25000 117000 50000 150000 400000 Liabilities and Shareholders' Equity Current Liabilities: Accounts Payable Income Tax Payable t Payable Current...
i need help on my retained earnings and income statement. i
have a income tax rate of 20% and my RE ending has to be 361,000.
not sure what i am missing on my income statement
here are some updated pictures
We were unable to transcribe this imageWe were unable to transcribe this imageWe were unable to transcribe this image17000 75000 25000 117000 50000 150000 400000 Liabilities and Shareholders' Equity Current Liabilities: Accounts Payable Income Tax Payable t Payable Current...
 i meed part b andwered
PART A Miller Corporation is a manufacturer of precision drill bits. The following information pertains to operations during the 2018 calendar year. Sales Revenue Direct Factory Labor $13.075,000 3.390,600 314,250 Indirect materials used Indirect Factory Labor Total Depreciation Total Utilities2 Distribution & Customer Service Costs 1,232,250 400,000 525,000 67,600 Insurance on Plant & Equipment Property Taxes 3 Administrative Wages & Salaries Advertising Expenses Sales Commission 85,000 90,000 876.500 77.500 6% of Sales Revenue Of the...
i meed part b andwered
PART A Miller Corporation is a manufacturer of precision drill bits. The following information pertains to operations during the 2018 calendar year. Sales Revenue Direct Factory Labor $13.075,000 3.390,600 314,250 Indirect materials used Indirect Factory Labor Total Depreciation Total Utilities2 Distribution & Customer Service Costs 1,232,250 400,000 525,000 67,600 Insurance on Plant & Equipment Property Taxes 3 Administrative Wages & Salaries Advertising Expenses Sales Commission 85,000 90,000 876.500 77.500 6% of Sales Revenue Of the...
 I already created the income statement, but now I need the above
question answered. Need help determining how to include the other
costs aside from the labor and material costs.
Walden Company makes and sells wooden furniture. A recent fire destroyed most of the company's accounting record. Mike Lawson, the manager of Walden Company, needs to prepare an income statement for an upcoming meeting with the company's board of directors. Because the key accounts are not usable, Mike asked the...
I already created the income statement, but now I need the above
question answered. Need help determining how to include the other
costs aside from the labor and material costs.
Walden Company makes and sells wooden furniture. A recent fire destroyed most of the company's accounting record. Mike Lawson, the manager of Walden Company, needs to prepare an income statement for an upcoming meeting with the company's board of directors. Because the key accounts are not usable, Mike asked the...
 I can't figure iut wbats wrong with the trial balance and t
accounts and maybe journal entries
NAME Financial Accounting Review Problem 1 JOURNALIZE THE FOLLOWING TRANSACTIONS 1. INVESTED $25.000 INTO JHJ SHOESTORE 2. Purchased $6,000 in SUPPLIES on account 3. PURCHASED 3,000 SHOES AT SIO EACH 4. PURCHASED 3,000 SHOES AT $20 EACH 5. Purchased 3,000 Shoes at $30 cach 6. PURCHASED $50,000 IN EQUIPMENT WITH A 5-year LIFE, PAYING $20,000 IN CASH AND PLACED THE REMAINING BALANCE ON...
I can't figure iut wbats wrong with the trial balance and t
accounts and maybe journal entries
NAME Financial Accounting Review Problem 1 JOURNALIZE THE FOLLOWING TRANSACTIONS 1. INVESTED $25.000 INTO JHJ SHOESTORE 2. Purchased $6,000 in SUPPLIES on account 3. PURCHASED 3,000 SHOES AT SIO EACH 4. PURCHASED 3,000 SHOES AT $20 EACH 5. Purchased 3,000 Shoes at $30 cach 6. PURCHASED $50,000 IN EQUIPMENT WITH A 5-year LIFE, PAYING $20,000 IN CASH AND PLACED THE REMAINING BALANCE ON...
Most questions answered within 3 hours.
-
Other decisions about scientific claims can have a much broader
impact.ENERGYarrow-10x10.png, environment, health, security - all...
asked 27 minutes ago -
I need to write a research paper and work cited about this
topic: The United States...
asked 50 minutes ago -
Hello! I was wondering if I could have some help?
If the vapor pressure of carvone...
asked 1 hour ago -
An economist wants to estimate the mean per capita income (in
thousands of dollars) for a...
asked 1 hour ago -
What would be the input/output characteristic of a circuit
obtained by putting two of your 2's-complementers...
asked 1 hour ago -
In Drosophila, the transition from the syncytial blastoderm
stage to the cellular blastoderm stage is a...
asked 1 hour ago -
Project management question:
Name 3 different types of resources (hint: humans are one
type)
asked 2 hours ago -
Consider the following reaction: C 2H 2( g) + 2H 2( g) C 2H 6(
g)...
asked 2 hours ago -
Consider a 1.0 L buffer containing 0.092 mol L-1 HCOOH and 0.100
mol L-1 HCOO-. What...
asked 2 hours ago -
Koch Realty has owned a vacant land with a FMV of
$775,000 and an adjusted basis...
asked 2 hours ago -
It is estimated 29% of all adults in United States invest in
stocks and that 85%...
asked 2 hours ago -
What does a 2-sided p value of 0.04 mean? (I am not asking if it
is...
asked 2 hours ago