The demand and supply schedules for a certain good are like follows: Demand Schedule &n
- The demand and supply schedules for a certain good are like follows:
Demand Schedule Supply Schedule
|
Price $ |
Quantity |
Price $ |
Quantity |
|
24 |
150 |
24 |
50 |
|
26 |
140 |
26 |
60 |
|
28 |
120 |
28 |
70 |
|
30 |
110 |
30 |
80 |
|
32 |
90 |
32 |
90 |
|
34 |
80 |
34 |
110 |
|
36 |
70 |
36 |
120 |
|
38 |
60 |
38 |
140 |
|
40 |
50 |
40 |
150 |
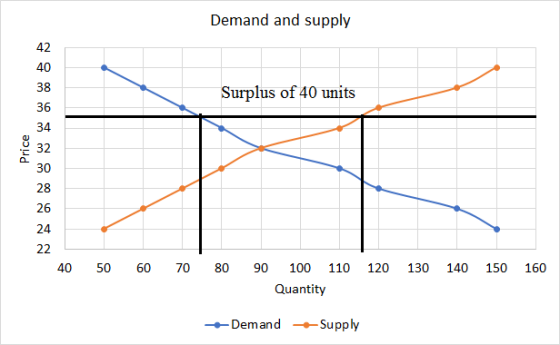
- Graph and label Demand and Supply.
- Find the equilibrium price and quantity from the graph.
- What will happen if the price is set at $35 Please specify the distance and term, also show it on the graph (at that specific price)
- What will happen if the price is set at $35 Please specify the distance and term, also show it on the graph (at that specific price)
Homework Answers
a) Graph is drawn below

b) At equilibrium demand curve meets supply curve. This gives an equilibrium price of $32 and an equilibrium quantity of 90 units
c) If price is set at $35, it will be acting as a binding price floor. At this price, quantity demanded will be less than quantity supplied and so there will be a surplus of 40 units
d) same as part c) because question is repeated.
Add Answer to:
The demand and supply schedules for a certain good are like
follows:
Demand
Schedule &n
please help 2. Problem solving (4 questions, 5 point each) 1. The demand and supply schedules...
 please help
2. Problem solving (4 questions, 5 point each) 1. The demand and supply schedules for potato chips are in the table. Price (cents per bag) 50 60 70 Quantity Quantity demanded supplied (millions of bags a week) 160 130 150 140 140 130 160 120 110 180 150 80 90 170 100 a. draw a graph of the potato chip market and mark in the equilibrium price and quantity b. If the price is 60€ a bag, is...
please help
2. Problem solving (4 questions, 5 point each) 1. The demand and supply schedules for potato chips are in the table. Price (cents per bag) 50 60 70 Quantity Quantity demanded supplied (millions of bags a week) 160 130 150 140 140 130 160 120 110 180 150 80 90 170 100 a. draw a graph of the potato chip market and mark in the equilibrium price and quantity b. If the price is 60€ a bag, is...
The figure illustrates the market for coffee in Guatemala Price 150 140 130 120 110 100...
 The figure illustrates the market for coffee in Guatemala Price 150 140 130 120 110 100 90 80 70 Domestic supply World pnce Domestic demand 50 30 20 10 2 468 10 12 14 16 18 20 22 24 26 28 30 32 34 36 38 40 42 44 46 48 50 52 Quanity Refer to Figure 9-1. With trade, Guatemala will export 22 units of coffee. export 10 units of coffee. import 30 units of coffee. import 12 units...
please answer the question c-f Q2 The demand and supply schedules for potato chips are in...
 please answer the question c-f
Q2 The demand and supply schedules for potato chips are in the table. 50 70 80 a) Draw a graph of the potato chip market and mark in the equilibrium price and quantity. Quantity Quantity Price demanded supplied b) If the price is 60¢ a bag, is there a shortage or a (cents per bag) (millions of bags a week) surplus, and how does the price adjust? 160 130 c) A new dip increases the...
please answer the question c-f
Q2 The demand and supply schedules for potato chips are in the table. 50 70 80 a) Draw a graph of the potato chip market and mark in the equilibrium price and quantity. Quantity Quantity Price demanded supplied b) If the price is 60¢ a bag, is there a shortage or a (cents per bag) (millions of bags a week) surplus, and how does the price adjust? 160 130 c) A new dip increases the...
1. The following are the assumed supply and demand schedules for Pepsi in Farmingdale in February...
 1. The following are the assumed supply and demand schedules for Pepsi in Farmingdale in February 2015: Demand Schedule Supply Schedule Quantity Quantity Demanded per year Supplied per year Price $2.25 $2.00 $1.75 $1.50 $1.25 $1.00 (thousands) (thousands) 16 20 24 28 32 Price $2.25 $2.00 $1.75 $1.50 $1.25 $1.00 30 28 26 24 20 A. Plot the supply and demand curves and indicate the equilibrium price and quantity Define: a) equilibrium price b) equilibrium quantity What effect would an...
Use the demand and supply schedule below to answer the following questions. Price of Garlic (per...
 Use the demand and supply schedule below to answer the following questions. Price of Garlic (per Quantity of Garlic Quantity of Garlic pound) Demanded Supplied $10 100 20 3080 40 50 60 70 - 40 9020 100 80 a. Graph the demand for garlic and the supply of garlic, and then indicate equilibrium in the garlic market. Instructions: Use the tools provided Supply' and 'Demand' to plot the supply and demand curves for this market (plot 5 points for each...
Use the demand and supply schedule below to answer the following questions. Price of Garlic (per...
 Use the demand and supply schedule below to answer the following questions. Price of Garlic (per Quantity of Garlic Quantity of Garlic pound) Demanded Supplied $10 100 20 30 80 40 50 60 70 60 40 20 80 100 90 a. Graph the demand for garlic and the supply of garlic, and then indicate equilibrium in the garlic market Instructions: Use the tools provided 'Supply' and 'Demand' to plot the supply and demand curves for this ma each curve). Use...
on 10 of 10 > Consider the supply and demand schedules for calzones at a local...
 on 10 of 10 > Consider the supply and demand schedules for calzones at a local pizzeria. Use the information in the schedules to answer the five questions. Demand Price (P) Quantity (Q) $13 S12 S11 SIO 59 $8 $7 56 55 54 20 40 60 80 100 120 140 160 180 20 Supply Price (P) Quantity (0 $4 55 56 57 $8 89 $10 SL $12 $13 20 30 40 50 60 70 80 90 100 110 What is...
According to the graph shown, if the price decreases from $22 to $16, consumer surplus would...
 According to the graph shown, if the price decreases from $22 to $16, consumer surplus would increase by Price $28 26 24 22 20 . 8 16 14 10 6 1 2 10 20 30 40 50 90 70 80 90 100 110 120 130 140 150 Quantity a. 120 b.360 c. 480 d. 600
Determine how many CH2 and CH3, CH and C (no hydrogen) groups are in the molecule....
 Determine how many CH2 and CH3, CH and C (no hydrogen) groups
are in the molecule. and how many proton groups are there. Does the
spectra agree with this?
Cholesterol in CDC13 Proton spectrum AAA M. T T 40 0.5 5 5,0 4.5 3.5 3.0 25 2.0 1,5 14 0 f1 (ppm) Cholesterol in CDC13 Carbon Spectrum ..demel. 135 130 80 10 50 145 140 125 120 115 110 105 100 95 90 85 70 75 f1 (ppm) 65 60...
Determine how many CH2 and CH3, CH and C (no hydrogen) groups
are in the molecule. and how many proton groups are there. Does the
spectra agree with this?
Cholesterol in CDC13 Proton spectrum AAA M. T T 40 0.5 5 5,0 4.5 3.5 3.0 25 2.0 1,5 14 0 f1 (ppm) Cholesterol in CDC13 Carbon Spectrum ..demel. 135 130 80 10 50 145 140 125 120 115 110 105 100 95 90 85 70 75 f1 (ppm) 65 60...
1 Price 15 14 13 Supply 12 11 10 9 8 7 6 Demand 10 20...
 1 Price 15 14 13 Supply 12 11 10 9 8 7 6 Demand 10 20 30 40 50 60 70 80 90 100 110 120 130 140 150 160 170 Quantity In the above figure, the vertical distance between points A and B represents a tax in the market. The amount of deadweight loss as a result of the tax is .... O A. $490. OB. $600. OC. $105. OD. $210.
 please help
2. Problem solving (4 questions, 5 point each) 1. The demand and supply schedules for potato chips are in the table. Price (cents per bag) 50 60 70 Quantity Quantity demanded supplied (millions of bags a week) 160 130 150 140 140 130 160 120 110 180 150 80 90 170 100 a. draw a graph of the potato chip market and mark in the equilibrium price and quantity b. If the price is 60€ a bag, is...
please help
2. Problem solving (4 questions, 5 point each) 1. The demand and supply schedules for potato chips are in the table. Price (cents per bag) 50 60 70 Quantity Quantity demanded supplied (millions of bags a week) 160 130 150 140 140 130 160 120 110 180 150 80 90 170 100 a. draw a graph of the potato chip market and mark in the equilibrium price and quantity b. If the price is 60€ a bag, is...
 The figure illustrates the market for coffee in Guatemala Price 150 140 130 120 110 100 90 80 70 Domestic supply World pnce Domestic demand 50 30 20 10 2 468 10 12 14 16 18 20 22 24 26 28 30 32 34 36 38 40 42 44 46 48 50 52 Quanity Refer to Figure 9-1. With trade, Guatemala will export 22 units of coffee. export 10 units of coffee. import 30 units of coffee. import 12 units...
 please answer the question c-f
Q2 The demand and supply schedules for potato chips are in the table. 50 70 80 a) Draw a graph of the potato chip market and mark in the equilibrium price and quantity. Quantity Quantity Price demanded supplied b) If the price is 60¢ a bag, is there a shortage or a (cents per bag) (millions of bags a week) surplus, and how does the price adjust? 160 130 c) A new dip increases the...
please answer the question c-f
Q2 The demand and supply schedules for potato chips are in the table. 50 70 80 a) Draw a graph of the potato chip market and mark in the equilibrium price and quantity. Quantity Quantity Price demanded supplied b) If the price is 60¢ a bag, is there a shortage or a (cents per bag) (millions of bags a week) surplus, and how does the price adjust? 160 130 c) A new dip increases the...
 1. The following are the assumed supply and demand schedules for Pepsi in Farmingdale in February 2015: Demand Schedule Supply Schedule Quantity Quantity Demanded per year Supplied per year Price $2.25 $2.00 $1.75 $1.50 $1.25 $1.00 (thousands) (thousands) 16 20 24 28 32 Price $2.25 $2.00 $1.75 $1.50 $1.25 $1.00 30 28 26 24 20 A. Plot the supply and demand curves and indicate the equilibrium price and quantity Define: a) equilibrium price b) equilibrium quantity What effect would an...
 Use the demand and supply schedule below to answer the following questions. Price of Garlic (per Quantity of Garlic Quantity of Garlic pound) Demanded Supplied $10 100 20 3080 40 50 60 70 - 40 9020 100 80 a. Graph the demand for garlic and the supply of garlic, and then indicate equilibrium in the garlic market. Instructions: Use the tools provided Supply' and 'Demand' to plot the supply and demand curves for this market (plot 5 points for each...
 Use the demand and supply schedule below to answer the following questions. Price of Garlic (per Quantity of Garlic Quantity of Garlic pound) Demanded Supplied $10 100 20 30 80 40 50 60 70 60 40 20 80 100 90 a. Graph the demand for garlic and the supply of garlic, and then indicate equilibrium in the garlic market Instructions: Use the tools provided 'Supply' and 'Demand' to plot the supply and demand curves for this ma each curve). Use...
 on 10 of 10 > Consider the supply and demand schedules for calzones at a local pizzeria. Use the information in the schedules to answer the five questions. Demand Price (P) Quantity (Q) $13 S12 S11 SIO 59 $8 $7 56 55 54 20 40 60 80 100 120 140 160 180 20 Supply Price (P) Quantity (0 $4 55 56 57 $8 89 $10 SL $12 $13 20 30 40 50 60 70 80 90 100 110 What is...
 According to the graph shown, if the price decreases from $22 to $16, consumer surplus would increase by Price $28 26 24 22 20 . 8 16 14 10 6 1 2 10 20 30 40 50 90 70 80 90 100 110 120 130 140 150 Quantity a. 120 b.360 c. 480 d. 600
 Determine how many CH2 and CH3, CH and C (no hydrogen) groups
are in the molecule. and how many proton groups are there. Does the
spectra agree with this?
Cholesterol in CDC13 Proton spectrum AAA M. T T 40 0.5 5 5,0 4.5 3.5 3.0 25 2.0 1,5 14 0 f1 (ppm) Cholesterol in CDC13 Carbon Spectrum ..demel. 135 130 80 10 50 145 140 125 120 115 110 105 100 95 90 85 70 75 f1 (ppm) 65 60...
Determine how many CH2 and CH3, CH and C (no hydrogen) groups
are in the molecule. and how many proton groups are there. Does the
spectra agree with this?
Cholesterol in CDC13 Proton spectrum AAA M. T T 40 0.5 5 5,0 4.5 3.5 3.0 25 2.0 1,5 14 0 f1 (ppm) Cholesterol in CDC13 Carbon Spectrum ..demel. 135 130 80 10 50 145 140 125 120 115 110 105 100 95 90 85 70 75 f1 (ppm) 65 60...
 1 Price 15 14 13 Supply 12 11 10 9 8 7 6 Demand 10 20 30 40 50 60 70 80 90 100 110 120 130 140 150 160 170 Quantity In the above figure, the vertical distance between points A and B represents a tax in the market. The amount of deadweight loss as a result of the tax is .... O A. $490. OB. $600. OC. $105. OD. $210.
Most questions answered within 3 hours.
-
The free energy change for the following reaction at 25 °C, when
[Sn2+] = 1.17 M...
asked 1 hour ago -
An MNE is this kind of industry when competition in one country
is essentially independent of...
asked 3 hours ago -
. For this set of questions, determine what
proportion of a normal distribution is located betweeneach...
asked 3 hours ago -
A college student is employed as a door-to-door newspaper
salesman. Historical data suggests that the student...
asked 4 hours ago -
MATLAB HW 11 problem using Switch Case and Input commands
Write a script file that calculates...
asked 4 hours ago -
Considering gravitational time dilation, calculate the time that
passes in Earth’s surface while 1 hour passes...
asked 4 hours ago -
Minitab Problem: Take the Lake Hume June rainfall data and find
use the processes outlined in...
asked 5 hours ago -
X Company is trying to decide whether to continue using old
equipment to make Product A...
asked 5 hours ago -
IN PYTHON ONLY !! Program 2: Re-work
program #5 (WeeklyHours) from the previous assignment such that...
asked 6 hours ago -
The average length of time between arrivals at a turnpike
toll-booth is 26 seconds. What is...
asked 8 hours ago -
(a) A piston at 6.1 atm contains a gas that occupies a volume of
3.5 L....
asked 9 hours ago -
Please answer true or false. Words
cannot be changed or added in to make it true...
asked 9 hours ago