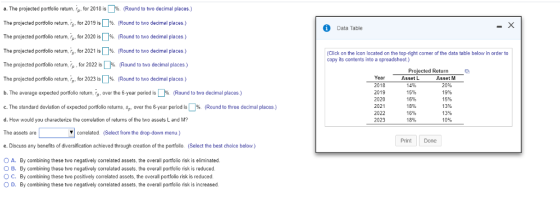
Assume you are considering a portfolio containing two assets, L and M. Asset L will represent 39 % of the dollar value of the portfolio, and asset M will account for the other 61 %. The projected returns over the next 6 years, 2018-2023, for each of these assets are summarized in the following table: LOADING....
a. Calculate the projected portfolio return, r over p, for each of the 6 years.
b. Calculate the average expected portfolio return, r over p, over the 6-year period.
c. Calculate the standard deviation of expected portfolio returns, s Subscript p, over the 6-year period.
d. How would you characterize the correlation of returns of the two assets L and M?
e. Discuss any benefits of diversification achieved through creation of the portfolio.
Homework Answers
a.The projected portfolio return for 2018 is 17.66%
The projected portfolio return for 2018 is 17.44%
The projected portfolio return for 2018 is 15.39%
The projected portfolio return for 2018 is 14.95%
The projected portfolio return for 2018 is 14.17%
The projected portfolio return for 2018 is 13.12%
b.15.45%
c.2.69%
d. negatively
e. b
The above has been calculated as follows -
| Year | Expected Return % Asset L | Expected Return % Asset M | Return | σ | (σ2) | Asset L (σ) | Asset L(σ2) | Asset M(σ) | Asset M(σ2) | σLσm |
| 2018 | 14 | 20 | 17.66 | 2.21 | 4.88 | -2.17 | 4.71 | 5 | 25 | -10.85 |
| 2019 | 15 | 19 | 17.44 | 1.99 | 3.96 | -1.17 | 1.37 | 4 | 16 | -4.68 |
| 2020 | 16 | 15 | 15.39 | -0.06 | 0.0036 | -0.17 | 0.029 | 0 | 0 | 0 |
| 2021 | 18 | 13 | 14.95 | -0.5 | 0.25 | 1.83 | 3.35 | -2 | 4 | -3.66 |
| 2022 | 16 | 13 | 14.17 | -1.28 | 1.64 | -0.17 | 0.029 | -2 | 4 | 0.34 |
| 2023 | 18 | 10 | 13.12 | -2.33 | 5.43 | 1.83 | 3.35 | -5 | 25 | -9.15 |
| Sum | 97 | 90 | 92.73 | 16.16 | ||||||
| Average | 16.17 | 15 | 15.45 | 2.69 | 2.14 | 12.33 | -28 | |||
Correlation coefficient = -28/√92.73√16.16
=-0.7233
Add Answer to:
Assume you are considering a portfolio containing two assets, L
and M. Asset L will represent...
Assume you are considering a portfolio containing two assets, L and M. Asset L will represent...
Assume you are considering a portfolio containing two assets, L and M. Asset L will represent 36% of the dollar value of the portfolio, and asset M will account for the other 64%. The projected returns over the next six years, 2018–2023, for each of these assets are summarized in the following table. *huge thumbs up for correct answers* Projected Return (%) Year Asset L Asset M 2018 15% 21% 2019 14% 17% 2020 16% 16% 2021 16% 14% 2022...
Assume you are considering a portfolio containing Asset 1 and Asset 2. Asset 1 will represent...
 Assume you are considering a portfolio containing Asset 1 and Asset 2. Asset 1 will represent 63% of the dollar value of the portfolio, and Asset 2 will account for the other 37%. The projected returns over t6 years, 2021-2026, for each of these assets are summarized in the following table: a. Calculate the projected portfolio retur, fp, for each of the 6 years. Data Table - X b. Calculate the average expected portfolio return, fp, over the 6-year period....
Assume you are considering a portfolio containing two assets, L and M Asset L will represent...
 Assume you are considering a portfolio containing two assets, L and M Asset L will represent 37% o the dollar value of the portfolio and asset M will account for the other 63%. The pro ected returns over he next 6 years, 2018-2023, for each of these assets are summarized in the following table: a. Calculate the projected portfollo return, rp for each of the 6 years. b. Calculate the average expected portolio return, rp, over the 6-year period. c....
Assume you are considering a portfolio containing two assets, L and M. Asset L will represent...
Assume you are considering a portfolio containing two assets, L and M. Asset L will represent 44% of the dollar value of the portfolio, and asset M will account for the other 56%. The projected returns over the next 6 years, 2018 - 2023, for each of these assets are summarized in the following table: Projected Return Year Asset L Asset M 2018 13% 19% 2019 14% 19% 2020 17% 15% 2021 16% 15% 2022 16% 11% 2023 18% 11%...
Assume you are considering a portfolio containing two assets, Land M. Asset L will represent 59...
 Assume you are considering a portfolio containing two assets, Land M. Asset L will represent 59 % of the dollar value of the portfolio, and asset M will account for the other 41 %. Assume that the portfolio is rebalanced at the end of each year. The expected returns over the next 6 years, 2018dash2023, for each of these assets are summarized in the following table: Year 2018 2019 2020 2021 2022 2023 Projected Return Asset L Asset M 13%...
Assume you are considering a portfolio containing two assets, L and M. Asset L will represent...
Assume you are considering a portfolio containing two assets, L and M. Asset L will represent 58 % of the dollar value of the portfolio, and asset M will account for the other 42 %. Assume that the portfolio is rebalanced at the end of each year. The expected returns over the next 6 years, 2018-2023, for each of these assets are summarized in the following table: Projected Return Year Asset L Asset M 2018 14% 19% 2019 13% 18%...
Assume you are considering a portfolio containing Asset 1 and Asset 2. Asset 1 will represent...
Assume you are considering a portfolio containing Asset 1 and Asset 2. Asset 1 will represent 38 % of the dollar value of the portfolio, and asset 2 will account for the other 62 %. Assume that the portfolio is rebalanced at the end of each year. The expected returns over the next 6 years, 2021--2026, for each of these assets are summarized in the following table: Projected Return Year Asset L Asset M 2021 -9 33...
5-12 Portfolio return and standard deviation Jamie Wong is considering building a portfolio containing two assets,...
 5-12 Portfolio return and standard deviation Jamie Wong is considering building a portfolio containing two assets, L and M. Asset L will represent 40% of the dollar value of the portfolio, and asset M will account for the other 60%. The expected returns over the next 6 years, 2004–2009, for each of these assets, are shown in the following table. Expected return Asset L Asset M Year 20% 14% 14 16 2004 2005 2006 2007 2008 2009 17 a. Calculate...
(Click on the icon located on the top-right corner of the data table below in order...
 (Click on the icon located on the top-right corner of the data table below in order to copy its contents into a spreadsheet.) Projected Returrn Asset M 19% 19% 17% 14% 11% 11% Asset L Year 2018 2019 2020 2021 2022 2023 15% 15% 16% 18% 18% 18% Ass ma you ara cons dann g a o olo containing to asse s and M Assat L rapresent 44% oft a dolar value a. Calculare the projected portfolio return, . or...
auate the portfolio standard deviation. 1ab iwolld w il ASsume you are considering a portfolio containing...
 auate the portfolio standard deviation. 1ab iwolld w il ASsume you are considering a portfolio containing two assets, L and M. Asset L will represent 40% of the dollar value of the portfolio, and asset M will account for the other A 60%. The projected returns over the next six years, 2018-2023, for each of these assets are summarized in the following table. Projected Return 91 192 to anin Year Asset L Asset M 2018 14% 20% inogo 2019 14%...
 Assume you are considering a portfolio containing Asset 1 and Asset 2. Asset 1 will represent 63% of the dollar value of the portfolio, and Asset 2 will account for the other 37%. The projected returns over t6 years, 2021-2026, for each of these assets are summarized in the following table: a. Calculate the projected portfolio retur, fp, for each of the 6 years. Data Table - X b. Calculate the average expected portfolio return, fp, over the 6-year period....
 Assume you are considering a portfolio containing two assets, L and M Asset L will represent 37% o the dollar value of the portfolio and asset M will account for the other 63%. The pro ected returns over he next 6 years, 2018-2023, for each of these assets are summarized in the following table: a. Calculate the projected portfollo return, rp for each of the 6 years. b. Calculate the average expected portolio return, rp, over the 6-year period. c....
 Assume you are considering a portfolio containing two assets, Land M. Asset L will represent 59 % of the dollar value of the portfolio, and asset M will account for the other 41 %. Assume that the portfolio is rebalanced at the end of each year. The expected returns over the next 6 years, 2018dash2023, for each of these assets are summarized in the following table: Year 2018 2019 2020 2021 2022 2023 Projected Return Asset L Asset M 13%...
 5-12 Portfolio return and standard deviation Jamie Wong is considering building a portfolio containing two assets, L and M. Asset L will represent 40% of the dollar value of the portfolio, and asset M will account for the other 60%. The expected returns over the next 6 years, 2004–2009, for each of these assets, are shown in the following table. Expected return Asset L Asset M Year 20% 14% 14 16 2004 2005 2006 2007 2008 2009 17 a. Calculate...
 (Click on the icon located on the top-right corner of the data table below in order to copy its contents into a spreadsheet.) Projected Returrn Asset M 19% 19% 17% 14% 11% 11% Asset L Year 2018 2019 2020 2021 2022 2023 15% 15% 16% 18% 18% 18% Ass ma you ara cons dann g a o olo containing to asse s and M Assat L rapresent 44% oft a dolar value a. Calculare the projected portfolio return, . or...
 auate the portfolio standard deviation. 1ab iwolld w il ASsume you are considering a portfolio containing two assets, L and M. Asset L will represent 40% of the dollar value of the portfolio, and asset M will account for the other A 60%. The projected returns over the next six years, 2018-2023, for each of these assets are summarized in the following table. Projected Return 91 192 to anin Year Asset L Asset M 2018 14% 20% inogo 2019 14%...
Most questions answered within 3 hours.
-
An MNE is this kind of industry when competition in one country
is essentially independent of...
asked 28 minutes ago -
. For this set of questions, determine what
proportion of a normal distribution is located betweeneach...
asked 1 hour ago -
A college student is employed as a door-to-door newspaper
salesman. Historical data suggests that the student...
asked 1 hour ago -
MATLAB HW 11 problem using Switch Case and Input commands
Write a script file that calculates...
asked 1 hour ago -
Considering gravitational time dilation, calculate the time that
passes in Earth’s surface while 1 hour passes...
asked 2 hours ago -
Minitab Problem: Take the Lake Hume June rainfall data and find
use the processes outlined in...
asked 3 hours ago -
X Company is trying to decide whether to continue using old
equipment to make Product A...
asked 3 hours ago -
IN PYTHON ONLY !! Program 2: Re-work
program #5 (WeeklyHours) from the previous assignment such that...
asked 3 hours ago -
The average length of time between arrivals at a turnpike
toll-booth is 26 seconds. What is...
asked 5 hours ago -
(a) A piston at 6.1 atm contains a gas that occupies a volume of
3.5 L....
asked 6 hours ago -
Please answer true or false. Words
cannot be changed or added in to make it true...
asked 6 hours ago -
An empty test tube weighs 15.923 grams. Then,
MgCl2•6H2O is added into the test tube. After...
asked 6 hours ago