
Homework Answers
| n= | 6.0000 | |
| X̅=ΣX/n | 3.830 | |
| Y̅=ΣY/n | 40.330 | |
| sx=(√(Σx2-(Σx)2/n)/(n-1))= | 1.940 | |
| sy=(√(Σy2-(Σy)2/n)/(n-1))= | 9.990 | |
| Cov=sxy=(ΣXY-(ΣXΣY)/n)/(n-1)= | 15.2667 | |
| r=Cov/(Sx*Sy)= | 0.7877 |
from above:

Cov=15.2667
r =0.7877

Add Answer to:
During an advertising campaign, the number of commercials and the sales level were recorded for each...
During an advertising campaign, the number of commercials and the sales level were recorded for each...
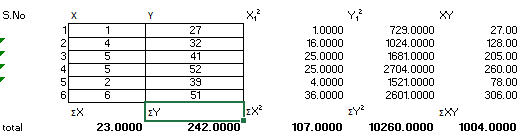
 During an advertising campaign, the number of commercials and the sales level were recorded for each of six different intervals Commercials Sales 32 4 27 39 52 51 6 Compute the covariance and the coefficient of correlation to measure how the number of commercials (X) and sales level (Y) are related to one another. First, in the following table, check the box to the left of each quantity if you need to compute that quantity in order to find the...
Answer options to last part: Weak or nonexistent/strong, Positive/negative, only slightly lower/only slightly higher/higher/lower During an...
 Answer options to last part: Weak or nonexistent/strong,
Positive/negative, only slightly lower/only slightly
higher/higher/lower
During an advertising campaign, the number of commercials and the sales level were recorded for each of six different intervals: Commercials Sales 4 5 5 2 6 27 32 41 52 39 51 Compute the covariance and the coefficient of correlation to measure how the number of commercials (X) and sales level (Y) are related to one another. First, in the following table, check the box...
Answer options to last part: Weak or nonexistent/strong,
Positive/negative, only slightly lower/only slightly
higher/higher/lower
During an advertising campaign, the number of commercials and the sales level were recorded for each of six different intervals: Commercials Sales 4 5 5 2 6 27 32 41 52 39 51 Compute the covariance and the coefficient of correlation to measure how the number of commercials (X) and sales level (Y) are related to one another. First, in the following table, check the box...
Design a spreadsheet to determine the impact on ad quality of paying for three draft commercials....
 Design a spreadsheet to determine the impact on ad quality of
paying for three draft commercials.
Write your answer/solution on word processor and submit as an
attachment.
DRAFT TV COMMERCIALS Your client directs TV advertising for a large corporation that currently relies on a single outside advertising agency. For years, ads have been created using the same plan: The agency creates a draft commercial and, after getting your client's approval, completes production and arranges for it to be aired has...
Design a spreadsheet to determine the impact on ad quality of
paying for three draft commercials.
Write your answer/solution on word processor and submit as an
attachment.
DRAFT TV COMMERCIALS Your client directs TV advertising for a large corporation that currently relies on a single outside advertising agency. For years, ads have been created using the same plan: The agency creates a draft commercial and, after getting your client's approval, completes production and arranges for it to be aired has...
Using the data in the frequency table below compute the correlation coefficient between advertising expenditure and sales. The data represent the number of months in which advertising expenditure was in a particular class AND sales were in a certain range
 Using the data in the frequency table below compute the correlation
coefficient between advertising expenditure and sales. The data represent
the number of months in which advertising expenditure was in a particular
class AND sales were in a certain range. (17)
(c) Interpret the result, explaining what the coefficient of determination means
and how it can be used. (2) [20]
Sales (R'000s)
10-19 20-29 30-39 40-49 50-59
100-199 12 3 0 2 0
Ad. expend. 200-299 0 8 3 4...
Using the data in the frequency table below compute the correlation
coefficient between advertising expenditure and sales. The data represent
the number of months in which advertising expenditure was in a particular
class AND sales were in a certain range. (17)
(c) Interpret the result, explaining what the coefficient of determination means
and how it can be used. (2) [20]
Sales (R'000s)
10-19 20-29 30-39 40-49 50-59
100-199 12 3 0 2 0
Ad. expend. 200-299 0 8 3 4...
48 57 Amy Bakery has four shops in different area in a city. Monthly sales (in...
 48 57 Amy Bakery has four shops in different area in a city. Monthly sales (in thousands of dollars) from a random of 24 months from each of the 4 shops given in Table 1. Table 1: Monthly sales (in thousands of dollars) North East South West 77 75 97 60 45 42 60 54 56 49 68 47 44 39 58 57 63 61 69 51 75 63 79 50 90 81 99 73 32 47 46 41 41...
36, Max believes that the sales of coffee at his coffee shop depend upon the weather....
 36, Max believes that the sales of coffee at his coffee shop depend upon the weather. He has taken a sample of 5 days. Below you are given the results of the sample. Cups of Coffee Sold 350 200 Temperature 50 60 210 100 70 80 60 90 40 100 Which variable is the dependent variable? a. of Coffee sold Cups b. Compute the least squares estimated line. Compute the correlation coefficient between temperature and the sales of coffee. c....
The coefficient of linear correlation between the sales and the number of employees is found to...
 The coefficient of linear correlation between the sales and the number of employees is found to be r=-0.66. Which of the following values cannot be the slope of the line of the linear regression? -2.7 . -1.8 -1.9 1.5 QUESTION 28 Management of a soft-drink bottling company wants to develop a method for allocating delivery costs to customers. The manager wants to analyze the relation between the time required to unload the cases of soft drink at the delivery point...
Problem 4: Variables that may affect Grades The data set contains a random sample of STAT 250 Final Exam Scores out of 80 points. For each individual sampled, the time (in hours per week) that the stu...
Problem 4: Variables that may affect Grades The data set contains a random sample of STAT 250 Final Exam Scores out of 80 points. For each individual sampled, the time (in hours per week) that the student spent participating in a GMU club or sport and working for pay outside of GMU was recorded. Values of 0 indicate the students either does not participate in a club or sport or does not work a job for pay. The goal of...
Professor Gill has taught General Psychology for many years. During the semester, she gives three multiple-choice...
 Professor Gill has taught General Psychology for many years. During the semester, she gives three multiple-choice exams, each worth 100 points. At the end of the course, Dr Gil gives a comprehensive alworth 200 poset, and represent students scores on exams 1, 2, and respectively. Let X represent the student's score on the final exam. Last semester De Gil had 25 students in her cess. The student exam scores are shows below 73 75 152 93 185 91 90 180...
A psychologist wanted to assess the relationship between depression and self-esteem. She believes that as depression...
A psychologist wanted to assess the relationship between depression and self-esteem. She believes that as depression increases, self-esteem decreases. She asked a group of 25 participants to complete both Beck’s Depression Inventory (Beck, Ward, Mendelson, Mock, & Erbaugh, 1961) and Rosenberg’s Self-Esteem Scale (1965). The data for each participant is as follows: Depression (X) Self-Esteem (Y) 60 11 27 34 15 33 30 24 56 14 52 16 40 23 49 33 24 27 38 26 48 17 58 10...
 During an advertising campaign, the number of commercials and the sales level were recorded for each of six different intervals Commercials Sales 32 4 27 39 52 51 6 Compute the covariance and the coefficient of correlation to measure how the number of commercials (X) and sales level (Y) are related to one another. First, in the following table, check the box to the left of each quantity if you need to compute that quantity in order to find the...
 Answer options to last part: Weak or nonexistent/strong,
Positive/negative, only slightly lower/only slightly
higher/higher/lower
During an advertising campaign, the number of commercials and the sales level were recorded for each of six different intervals: Commercials Sales 4 5 5 2 6 27 32 41 52 39 51 Compute the covariance and the coefficient of correlation to measure how the number of commercials (X) and sales level (Y) are related to one another. First, in the following table, check the box...
Answer options to last part: Weak or nonexistent/strong,
Positive/negative, only slightly lower/only slightly
higher/higher/lower
During an advertising campaign, the number of commercials and the sales level were recorded for each of six different intervals: Commercials Sales 4 5 5 2 6 27 32 41 52 39 51 Compute the covariance and the coefficient of correlation to measure how the number of commercials (X) and sales level (Y) are related to one another. First, in the following table, check the box...
 Design a spreadsheet to determine the impact on ad quality of
paying for three draft commercials.
Write your answer/solution on word processor and submit as an
attachment.
DRAFT TV COMMERCIALS Your client directs TV advertising for a large corporation that currently relies on a single outside advertising agency. For years, ads have been created using the same plan: The agency creates a draft commercial and, after getting your client's approval, completes production and arranges for it to be aired has...
Design a spreadsheet to determine the impact on ad quality of
paying for three draft commercials.
Write your answer/solution on word processor and submit as an
attachment.
DRAFT TV COMMERCIALS Your client directs TV advertising for a large corporation that currently relies on a single outside advertising agency. For years, ads have been created using the same plan: The agency creates a draft commercial and, after getting your client's approval, completes production and arranges for it to be aired has...
 48 57 Amy Bakery has four shops in different area in a city. Monthly sales (in thousands of dollars) from a random of 24 months from each of the 4 shops given in Table 1. Table 1: Monthly sales (in thousands of dollars) North East South West 77 75 97 60 45 42 60 54 56 49 68 47 44 39 58 57 63 61 69 51 75 63 79 50 90 81 99 73 32 47 46 41 41...
 36, Max believes that the sales of coffee at his coffee shop depend upon the weather. He has taken a sample of 5 days. Below you are given the results of the sample. Cups of Coffee Sold 350 200 Temperature 50 60 210 100 70 80 60 90 40 100 Which variable is the dependent variable? a. of Coffee sold Cups b. Compute the least squares estimated line. Compute the correlation coefficient between temperature and the sales of coffee. c....
 The coefficient of linear correlation between the sales and the number of employees is found to be r=-0.66. Which of the following values cannot be the slope of the line of the linear regression? -2.7 . -1.8 -1.9 1.5 QUESTION 28 Management of a soft-drink bottling company wants to develop a method for allocating delivery costs to customers. The manager wants to analyze the relation between the time required to unload the cases of soft drink at the delivery point...
 Professor Gill has taught General Psychology for many years. During the semester, she gives three multiple-choice exams, each worth 100 points. At the end of the course, Dr Gil gives a comprehensive alworth 200 poset, and represent students scores on exams 1, 2, and respectively. Let X represent the student's score on the final exam. Last semester De Gil had 25 students in her cess. The student exam scores are shows below 73 75 152 93 185 91 90 180...
Most questions answered within 3 hours.
-
Calculate the pH of each of the following solutions.
0.50 M HBr
3.1×10⁻⁴ M KOH
4.2×10⁻⁵...
asked 24 minutes ago -
For the year ended December 31, Depot Max’s cost of merchandise
sold was $85,600. Inventory at the...
asked 23 minutes ago -
Week 10 - Professional Memo Assignment
Professional Memo Assignment
Your mission for this week, should you...
asked 28 minutes ago -
Write a Python program that stores the data for each
player on the team, and it...
asked 38 minutes ago -
In
the last 3 months, mike never knows when he is going to get his
allowance...
asked 1 hour ago -
Is Ca(OH)2 a Bronsted base, Lewis base, or both? Why?
asked 52 minutes ago -
1A- Why don’t voters complain about U.S. tariffs on imported
sugar?
Because sugar is only a...
asked 1 hour ago -
Cash Payback Period
Primera Banco is evaluating two capital investment proposals for
a drive-up ATM kiosk,...
asked 1 hour ago -
Create a button in Swift (Xcode) that will create a charge,
create a charge using Stripe's...
asked 1 hour ago -
The reaction rate of CO and NO2 in the reaction
CO(g) + NO2(g) → CO2(g) +...
asked 1 hour ago -
Imagine that a chemist puts 6.40 mol each of
C3H8 and O2 in a 1.00-L container...
asked 1 hour ago -
How much money should be invested today in order to have $8340
at the end of...
asked 1 hour ago