Assume you wish to evaluate the risk and return behaviors associated with various combinations of assets...
Assume you wish to evaluate the risk and return behaviors associated with various combinations of assets V and W under three assumed degrees of correlation: perfect positive, uncorrelated, and perfect negative. The following average return and risk values were calculated for these assets:
|
Asset |
Average Return, r |
Risk (Standard Deviation), s |
|||
|
V |
7.9% |
4.6% |
|||
|
W |
12.7% |
9.7% |
|||
a. If the returns of assets V and W are perfectly positively correlated (correlation coefficient = + 1), describe the range of (1) return and (2) risk associated with all possible portfolio combinations.
b. If the returns of assets V and W are uncorrelated (correlation coefficient = 0), describe the approximate range of (1) return and (2) risk associated with all possible portfolio combinations.
c. If the returns of assets V and W are perfectly negatively correlated (correlation coefficient = - 1), describe the range of (1) return and (2) risk associated with all possible portfolio combinations.
Homework Answers
- Return of Portfolio (Rp)
It is weighted average of individual stock return in a portfolio. Two-Assets Portfolio Return formula provided below -
Where,
W = Weight of Stock
R = Return of Stock
- Standard
Deviation(risk) of Portfolio (
)
It measures the risk of Portfolio. Risk of two assets Portfolio formula provided below-
- Possible Portfolio Combination
It refers to portfolio on optimal portfolio frontier which means each portfolio provide higher return for higher level of risk. portfolio having low return for high risk should be rejected.
1.
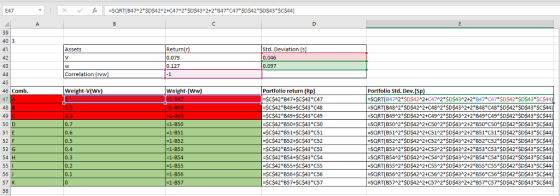
Please refer to following spreadsheet and graph for Return and risk of Possible Portfolio combination having stock V and W perfectly positive correlated.

Formula Reference -

We can see in above calculation and graph, when V and W are perfectly positive correlated then all the combination A to Z are optimal which means there is always higher return for higher risk. combination highlighted in green are optimal.
2.
Please refer to following spreadsheet and graph for Return and risk of Possible Portfolio combination having stock V and W uncorrelated.

Formula Reference -

We can see in above calculation and graph, when V and W are uncorrelated then only combination C to Z are optimal .and combination A & B which are highlighted in red is not optimal which it has lower return for higher risk.
3.
Please refer to following spreadsheet and graph for Return and risk of Possible Portfolio combination having stock V and W perfectly negative correlated.

Formula Reference -
Combination highlighted in green D to Z are optimal and combination A,B&C highlighted in red are not optimal.
Add Answer to:
Assume you wish to evaluate the risk and return behaviors
associated with various combinations of assets...
LG4 5-14 Correlation, risk, and return Matt Peters wishes to evaluate the risk and return behaviors...
 LG4 5-14 Correlation, risk, and return Matt Peters wishes to evaluate the risk and return behaviors associated with various combinations of assets V and W under three assumed degrees of correlation: perfect positive, uncorrelated, and perfect nega- tive. The expected return and risk values calculated for each of the assets are shown in the following table. Asset Expected return, k Risk (standard deviation), V 5% 8% 13 a. If the returns of assets V and W are perfectly positively correlated...
Assume you wish to evaluate the risk and return behaviors associated with various combinations of two stocks, Alpha Sof...
Assume you wish to evaluate the risk and return behaviors associated with various combinations of two stocks, Alpha Software and Beta Electronics, under three possible degrees of correlation: perfect positive, uncorrelated, and perfect negative. The average return and standard deviation for each stock appears here: Asset Average Return,overbar r Risk (Standard Deviation), s Alpha 5.1% 30.3% Beta 11.2% 50.5% a. If the returns of assets Alpha and Beta are perfectly positively correlated (correlation coefficient equals plus 1),...
Correlation, risk, and return Matt Peters wishes to evaluate the risk and return behaviors associated with...
 Correlation, risk, and return Matt Peters wishes to evaluate the risk and return behaviors associated with various combinations of assets V and W under three assumed degrees of correlation: perfectly positive, uncorrelated, and perfectly negative. The expected return and risk values calculated for each of the assets are shown in the following table, B a. If the returns of assets V and W are perfectly positively correlated correlation coefficient = +1), describe the range of (1) expected return and (2)...
le three alternatives. c. Use your findings in parts a and b to calculate the coefficient of variatio each of the three...
 le three alternatives. c. Use your findings in parts a and b to calculate the coefficient of variatio each of the three alternatives. d. On the basis of your findings, which of the three investment alternatives do recommend? Why? LG 4 P8-15 Correlation, risk, and return Matt Peters wishes to evaluate the risk and return be haviors associated with various combinations of assets V and W under three as- sumed degrees of correlation: perfectly positive, uncorrelated, and perfectly negative The...
p8-15 A-C 333 CHAPTER 8 Risk and Return a. If the returns of assets V and...
 p8-15 A-C
333 CHAPTER 8 Risk and Return a. If the returns of assets V and W are perfectly positively correlated (correlation coefficient = +1), describe the range of (1) expected return and (2) risk associ- ated with all possible portfolio combinations. b. If the returns of assets V and W are uncorrelated (correlation coefficient = 0), describe the approximate range of (1) expected return and (2) risk associated with all possible portfolio combinations c. If the returns of assets...
p8-15 A-C
333 CHAPTER 8 Risk and Return a. If the returns of assets V and W are perfectly positively correlated (correlation coefficient = +1), describe the range of (1) expected return and (2) risk associ- ated with all possible portfolio combinations. b. If the returns of assets V and W are uncorrelated (correlation coefficient = 0), describe the approximate range of (1) expected return and (2) risk associated with all possible portfolio combinations c. If the returns of assets...
2. 3: Risk and Rates of Return: Risk in Portfolio Context Risk and Rates of Return:...
 2. 3: Risk and Rates of Return: Risk in Portfolio Context Risk
and Rates of Return: Risk in Portfolio Context The capital asset
pricing model (CAPM) explains how risk should be considered when
stocks and other assets are held . The CAPM states that any stock's
required rate of return is the risk-free rate of return plus a risk
premium that reflects only the risk remaining diversification. Most
individuals hold stocks in portfolios. The risk of a stock held in...
2. 3: Risk and Rates of Return: Risk in Portfolio Context Risk
and Rates of Return: Risk in Portfolio Context The capital asset
pricing model (CAPM) explains how risk should be considered when
stocks and other assets are held . The CAPM states that any stock's
required rate of return is the risk-free rate of return plus a risk
premium that reflects only the risk remaining diversification. Most
individuals hold stocks in portfolios. The risk of a stock held in...
Term Answer Description Risk A. The potential for variability in the possible outcomes associated with an...
 Term Answer Description Risk A. The potential for variability in the possible outcomes associated with an investment. Expected rate of return The portion of an asset's total expected return required by investors as compensation for assuming the additional risks associated with the security, the issuer, and the marketplace. Beta coefficient That portion of an investment's risk calculated as the difference between its total risk and its firm-specific risk. Market risk The mean of the probability distribution of an investment's possible...
od The capital asset pricing model (CAPM) explains how risk should be considered when stocks and...
 od The capital asset pricing model (CAPM) explains how risk should be considered when stocks and other assets are held -Select- The CAPM states that any stock's required rate of return is -Select the risk-free rate of return plus a risk premium that reflects only the risk remaining -Select- diversification. Most individuals hold stocks in portfolios. The risk of a stock held in a portfolio is typically -Select the stock's risk when it is held alone. Therefore, the risk and...
Ch 02: Assignment - Risk and Return: Part 1 Term Answer Risk A Expected rate of...
 Ch 02: Assignment - Risk and Return: Part 1 Term Answer Risk A Expected rate of return B Description The rate of return expected to be realized from an investment, calculated as the mean of the probability distribution of its possible returns. The term applied to the risk of an asset that is measured by the standard deviation of the asset's expected returns. The possibility that an actual outcome will be better or worse than its expected outcome The general...
Assume you are considering a portfolio containing two assets, L and M. Asset L will represent...
Assume you are considering a portfolio containing two assets, L and M. Asset L will represent 36% of the dollar value of the portfolio, and asset M will account for the other 64%. The projected returns over the next six years, 2018–2023, for each of these assets are summarized in the following table. *huge thumbs up for correct answers* Projected Return (%) Year Asset L Asset M 2018 15% 21% 2019 14% 17% 2020 16% 16% 2021 16% 14% 2022...
 LG4 5-14 Correlation, risk, and return Matt Peters wishes to evaluate the risk and return behaviors associated with various combinations of assets V and W under three assumed degrees of correlation: perfect positive, uncorrelated, and perfect nega- tive. The expected return and risk values calculated for each of the assets are shown in the following table. Asset Expected return, k Risk (standard deviation), V 5% 8% 13 a. If the returns of assets V and W are perfectly positively correlated...
 Correlation, risk, and return Matt Peters wishes to evaluate the risk and return behaviors associated with various combinations of assets V and W under three assumed degrees of correlation: perfectly positive, uncorrelated, and perfectly negative. The expected return and risk values calculated for each of the assets are shown in the following table, B a. If the returns of assets V and W are perfectly positively correlated correlation coefficient = +1), describe the range of (1) expected return and (2)...
 le three alternatives. c. Use your findings in parts a and b to calculate the coefficient of variatio each of the three alternatives. d. On the basis of your findings, which of the three investment alternatives do recommend? Why? LG 4 P8-15 Correlation, risk, and return Matt Peters wishes to evaluate the risk and return be haviors associated with various combinations of assets V and W under three as- sumed degrees of correlation: perfectly positive, uncorrelated, and perfectly negative The...
 p8-15 A-C
333 CHAPTER 8 Risk and Return a. If the returns of assets V and W are perfectly positively correlated (correlation coefficient = +1), describe the range of (1) expected return and (2) risk associ- ated with all possible portfolio combinations. b. If the returns of assets V and W are uncorrelated (correlation coefficient = 0), describe the approximate range of (1) expected return and (2) risk associated with all possible portfolio combinations c. If the returns of assets...
p8-15 A-C
333 CHAPTER 8 Risk and Return a. If the returns of assets V and W are perfectly positively correlated (correlation coefficient = +1), describe the range of (1) expected return and (2) risk associ- ated with all possible portfolio combinations. b. If the returns of assets V and W are uncorrelated (correlation coefficient = 0), describe the approximate range of (1) expected return and (2) risk associated with all possible portfolio combinations c. If the returns of assets...
 2. 3: Risk and Rates of Return: Risk in Portfolio Context Risk
and Rates of Return: Risk in Portfolio Context The capital asset
pricing model (CAPM) explains how risk should be considered when
stocks and other assets are held . The CAPM states that any stock's
required rate of return is the risk-free rate of return plus a risk
premium that reflects only the risk remaining diversification. Most
individuals hold stocks in portfolios. The risk of a stock held in...
2. 3: Risk and Rates of Return: Risk in Portfolio Context Risk
and Rates of Return: Risk in Portfolio Context The capital asset
pricing model (CAPM) explains how risk should be considered when
stocks and other assets are held . The CAPM states that any stock's
required rate of return is the risk-free rate of return plus a risk
premium that reflects only the risk remaining diversification. Most
individuals hold stocks in portfolios. The risk of a stock held in...
 Term Answer Description Risk A. The potential for variability in the possible outcomes associated with an investment. Expected rate of return The portion of an asset's total expected return required by investors as compensation for assuming the additional risks associated with the security, the issuer, and the marketplace. Beta coefficient That portion of an investment's risk calculated as the difference between its total risk and its firm-specific risk. Market risk The mean of the probability distribution of an investment's possible...
 od The capital asset pricing model (CAPM) explains how risk should be considered when stocks and other assets are held -Select- The CAPM states that any stock's required rate of return is -Select the risk-free rate of return plus a risk premium that reflects only the risk remaining -Select- diversification. Most individuals hold stocks in portfolios. The risk of a stock held in a portfolio is typically -Select the stock's risk when it is held alone. Therefore, the risk and...
 Ch 02: Assignment - Risk and Return: Part 1 Term Answer Risk A Expected rate of return B Description The rate of return expected to be realized from an investment, calculated as the mean of the probability distribution of its possible returns. The term applied to the risk of an asset that is measured by the standard deviation of the asset's expected returns. The possibility that an actual outcome will be better or worse than its expected outcome The general...
Most questions answered within 3 hours.
-
A dragon biologist is setting up an experimental population of
1000 individuals. In dragons, pointy crests...
asked 53 seconds from now -
A uniform thin rod of length 0.851 m is hung from a horizontal
nail passing through...
asked 9 minutes ago -
A 747 has a cruising speed of 235 m/s at a height of 10,700
meters. The...
asked 17 minutes ago -
Part 3: Arrows
Write a python program that prompts the user for a number of
columns,...
asked 25 minutes ago -
Need help answering these questions!!
1. What economic concept do you find most interesting in
Macroeconomics?...
asked 29 minutes ago -
1. Nimbus, Inc. produces and sells brooms. This table shows the
relationship between the number of...
asked 32 minutes ago -
A gas occupies 200. mL in a piston. If the pressure of the
piston were decreased...
asked 49 minutes ago -
A fossil is found to have a 14C level of 71.0% compared to
living organisms. How...
asked 53 minutes ago -
Many communist or socialist countries have a department that
addresses public health as well as the...
asked 54 minutes ago -
the following questions are either true or false answers
1. The Central Limit Theorem allows one...
asked 55 minutes ago -
The patient recovery time from a particular surgical procedure
is normally distributed with a mean of...
asked 1 hour ago -
Human relations refer to the way a company arranges people,
jobs, and communications so that work...
asked 1 hour ago