Question
How close to a normal distribution are these two histograms?
Explain any discrepancy.


Homework Answers
Answer #1
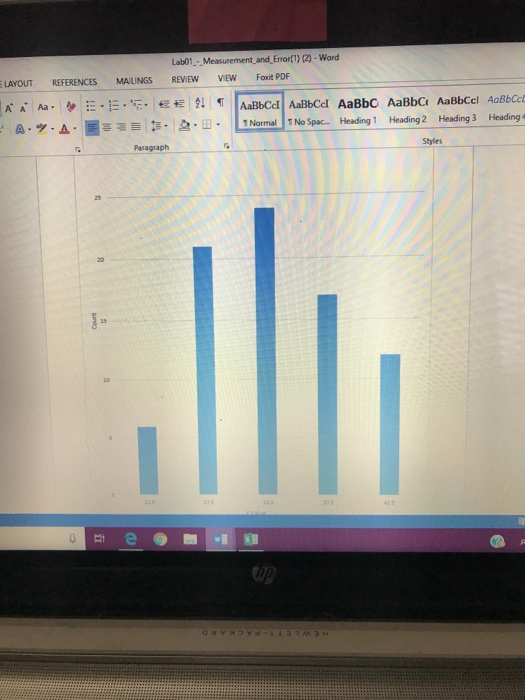
Normal Distribution is a symmetric Distribution about its mean.
According to the above two histograms , the first one is not look like a symmetric one so it is not likely to be a normal distribution.
But the second one is look like a symmetric histogram and this could be a histogram of the data having a normal distribution.
a point to be noted that in normal distribution the curve have thin tails , the reason why the mean variance and higher order moments are exists. The first graph has a thick tails so this is not a graph of normal distribution.
Know the answer?
Add Answer to:
How close to a normal distribution are these two histograms?
Explain any discrepancy.
Lab01 -Measurement-and-Error(1)(2-word OUT...
Not the answer you're looking for?
Ask your own homework help question.
Our experts will answer your question WITHIN MINUTES for Free.
Similar Homework Help Questions
ADVERTISEMENT
Need Online Homework Help?
Ask
a QuestionGet Answers For Free
Most questions answered within 3 hours.
Most questions answered within 3 hours.
ADVERTISEMENT
ADVERTISEMENT
Active Questions
-
3) What are the typical social structures in a global city?
asked 1 hour ago -
Luther Corporation
Consolidated Balance Sheet
December 31, 2019 and 2018 (in $ millions)
Assets
2019
2018...
asked 1 hour ago -
(Expected rate of return and risk) Carter Inc. is evaluating a
security. Calculate the investment’s expected...
asked 4 hours ago -
What specific indicators can point to lack of progress for
African Americans in American society?
asked 5 hours ago -
1-The Electrons in a beam are moving at 2.7×10⁸ m/s in an
electric field of 15000...
asked 5 hours ago -
A gas tank is a vertical cylinder. It has a radius of 1m, a
height of...
asked 5 hours ago -
Accent Software faces the following conditions. All of these
support Accent’s use of a market-penetration pricing...
asked 6 hours ago -
A mathematically inclined friend emails you the following
instructions: "Meet me in the cafeteria the first...
asked 6 hours ago -
A monopoly sells in two countries . The demand curves in the two
countries are p1...
asked 7 hours ago -
A .15kg rubber ball is bounced off a wall. Before hitting the
wall, the ball moves...
asked 8 hours ago -
A manufacturing company preparing to build a new plant is
considering three potential locations for it....
asked 8 hours ago -
B. If compound Y has approximately the same values of solubility
in toluene as compound X,...
asked 9 hours ago
ADVERTISEMENT