


Homework Answers

Add Answer to:
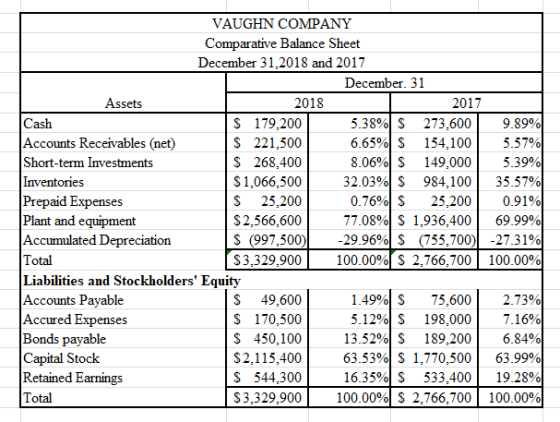
Presented below is the comparative balance sheet for Vaughn Company. VAUGHN COMPANY COMPARATIVE BALANCE SHEET AS...
Prepare a comparative balance sheet of Skysong Company showing the dollar change and the percent change...
 Prepare a comparative balance sheet of Skysong Company showing the dollar change and the percent change for each item. either a negative sign, i.e. -92,000, -25.25 or parent i.e. -92,000, -25.25 or parenthesis, i.e. (92,000), (25.25)) SKYSONG COMPANY Comparative Balance Sheet December 31, 2018 and 2017 December 31 Increase or (Decrease) 2018 2017 $ Change % Change Assets Cash $179,700 $273,700 Accounts receivable (net) 219,900 153,800 Investments 269,000 149,000 Inventories 1,056,200 988,300 Prepaid expenses 25,100 25,100 Plant and equipment 2,583,400...
Presented below is the comparative balance sheet for Skysong Company. SKYSONG COMPANY COMPARATIVE BALANCE SHEET AS...
 Presented below is the comparative balance sheet for Skysong Company. SKYSONG COMPANY COMPARATIVE BALANCE SHEET AS OF DECEMBER 31, 2018 AND 2017 December 31 2018 2017 Assets Cash Accounts receivable (net) Short-term investments Inventories Prepaid expenses Plant & equipment Accumulated depreciation $179,700 219,900 269,000 1,056,200 25,100 2,583,400 (993,200) $273,700 153,800 149,000 988,300 25,100 1,944,700 (756,300) $2,778,300 $3,340,100 Liabilities and Stockholders' Equity Accounts payable Accrued expenses Bonds payable Capital stock $49,800 169,600 452,600 2,093, 100 575,000 $3,340,100 $75,000 198,600 191,400 1,760,400...
Problem 24-04 a-b Presented below is the comparative balance sheet for Waterway Company. Waterway Company Comparative...
 Problem 24-04 a-b Presented below is the comparative balance sheet for Waterway Company. Waterway Company Comparative Balance Sheet As of December 31, 2021 and 2020 December 31 2021 2022 Assets Cash $180,400 $277,100 Accounts receivable (net) 220,000 156,500 Short-term investments 267,600 150,500 Inventories 1,051,400 973,400 Prepaid expenses 24,900 24,900 Plant & equipment 2,592,300 1,931,100 Accumulated depreciation (1,004,900 (753,800 $3,331,700 $2,759,700 Liabilities and Stockholders' Equity Accounts payable Accrued expenses Bonds payable Capital stock Retained earnings $50,400 169,100 453,100 2,079,500 579,600 $3,331,700...
Problem 24-04 a-b Presented below is the comparative balance sheet for Windsor Company. Windsor Company Comparative...
 Problem 24-04 a-b Presented below is the comparative balance sheet for Windsor Company. Windsor Company Comparative Balance Sheet As of December 31, 2021 and 2020 December 31 2021 2022 Assets Cash $178,400 $277,400 Accounts receivable (net) 218,900 156,300 Short-term investments 271,200 151,500 Inventories 1,068,100 980,700 Prepaid expenses 25,000 25,000 Plant & equipment 2,597,900 1,964,800 Accumulated depreciation (1,008,200) (745,200) $3,351,300 $2,810,500 Liabilities and Stockholders' Equity Accounts payable Accrued expenses Bonds payable Capital stock Retained earnings $49,500 169,600 450,500 2,093,700 588,000 $3,351,300...
Condensed financial data of Vaughn Company for 2017 and 2016 are presented below VAUGHN COMPANY COMPARATIVE...
 Condensed financial data of Vaughn Company for 2017 and 2016 are presented below VAUGHN COMPANY COMPARATIVE BALANCE SHEET AS OF DECEMBER 31, 2017 AND 2016 Cash Receivables Inventory Plant assets Accumulated depreciation Long-term investments (held-to-maturity) 2017 $1,800 1,750 1,630 1,910 2016 $1,130 1,320 1,890 1,720 (1,190) (1,170) 1,280 $7,180 1,410 $6,300 Accounts payable Accrued liabilities Bonds payable Common stock Retained earnings $1,230 190 1,400 1,930 2,430 $7,180 $910 240 1,540 1,680 1,930 $6,300
Question The comparative balance sheet for Earl Company is presented below: Earl Company Comparative Balance Sheet...
 Question The comparative balance sheet for Earl Company is presented below: Earl Company Comparative Balance Sheet 31 December 20X8 and 20X7 20X7 $33,100 8,500 48,000 30,000 20X8 $41,000 ? Assets Cash Supplies Land 48,000 34,500 Equipment Liabilities and Equity Accounts payable Notes payable Capital stock Retained earnings $18,500 29,600 52,000 ? $21,400 28,000 52,000 35,100 Additional information for Earl's 20X8 operations revealed that the company had revenues of $68,000 for the year and no dividends were paid. Required Based on...
Presented below is the 2018 income statement and comparative balance sheet information for Tiger Enterprises TIGER...
 Presented below is the 2018 income statement and comparative balance sheet information for Tiger Enterprises TIGER ENTERPRISES Income Statement For the Year Ended December 31, 2018 $15,000 Sales revenue Operating expenses: Cost of goods sold 5,000 Depreciation 400 960 3,400 Insurance Administrative and other Total operating expenses Income before income taxes Income tax expense Net income 9,700 5, 300 2,120 s 3,188 Balance Sheet Information ( in thousands) Dec. 31,2018 Dec. 31, 2017 Assets: Cash Accounts receivable Inventory Prepaid insurance...
A comparative balance sheet for Rocher Company appears below ROCKER COMPANY Comparative Balance Sheet Dec 31,...
 A comparative balance sheet for Rocher Company appears below ROCKER COMPANY Comparative Balance Sheet Dec 31, 2012 Dec 31, 2018 $11.000 $ 34,000 18.000 25.000 6.000 17 000 Accounts roonivable Inventory Prepaid expenses Long-term investments Equipment Accumulated depreciation Totalans 60 000 9.000 17.000 33 000 (15.000 $85.000 equipment $123.000 Liabilities and Stockholders' Equity Accounts payable $17.000 Bonds payable 30.000 Common stock 40.000 Rated earings 30.000 Totallaties and stockholders' equity $120.000 $ 7000 45.000 23.000 10.000 $85.000 Additional information 1 Net...
Presented below is the 2018 income statement and comparative balance sheet information for Tiger Enterprises. TIGER...
 Presented below is the 2018 income statement and comparative balance sheet information for Tiger Enterprises. TIGER ENTERPRISES Income Statement For the Year Ended December 31, 2018 ($ in thousands) Sales revenue $10,500 Operating expenses: Cost of goods sold $4,100 Depreciation 310 Insurance 450 Administrative and other 2,500 Total operating expenses 7, 360 Income before income taxes 3, 140 Income tax expense 1,256 Net income $ 1,884 Balance Sheet Information ($ in thousands) Dec. 31, 2018 Dec. 31, 2017 Assets: Cash...
The comparative balance sheets for Spicer Company as of December 31 are presented below Spicer Company...
 The comparative balance sheets for Spicer Company as of December 31 are presented below Spicer Company Comparative Balance Sheets December 31 Assets Cash Accounts receivable Inventory Prepaid expenses Land Buildings Accumulated depreciation-buildings Equipment Accumulated depreciation-equipment Total 2017 2016 $ 45,000 58,000 142,000 21,000 130,000 200,000 (40,000 ) 155,000 68,000 50,000 151,450 15,280 145,000 200,000 (60,000) 225,000 (45,000) (35,000) $749,730 $676,000 Liabilities and Stockholders Equity Accounts payable Bonds payable Common stock, $1 par Retained earnings Total $ 36,000 300,000 160,000 180,000...
 Prepare a comparative balance sheet of Skysong Company showing the dollar change and the percent change for each item. either a negative sign, i.e. -92,000, -25.25 or parent i.e. -92,000, -25.25 or parenthesis, i.e. (92,000), (25.25)) SKYSONG COMPANY Comparative Balance Sheet December 31, 2018 and 2017 December 31 Increase or (Decrease) 2018 2017 $ Change % Change Assets Cash $179,700 $273,700 Accounts receivable (net) 219,900 153,800 Investments 269,000 149,000 Inventories 1,056,200 988,300 Prepaid expenses 25,100 25,100 Plant and equipment 2,583,400...
 Presented below is the comparative balance sheet for Skysong Company. SKYSONG COMPANY COMPARATIVE BALANCE SHEET AS OF DECEMBER 31, 2018 AND 2017 December 31 2018 2017 Assets Cash Accounts receivable (net) Short-term investments Inventories Prepaid expenses Plant & equipment Accumulated depreciation $179,700 219,900 269,000 1,056,200 25,100 2,583,400 (993,200) $273,700 153,800 149,000 988,300 25,100 1,944,700 (756,300) $2,778,300 $3,340,100 Liabilities and Stockholders' Equity Accounts payable Accrued expenses Bonds payable Capital stock $49,800 169,600 452,600 2,093, 100 575,000 $3,340,100 $75,000 198,600 191,400 1,760,400...
 Problem 24-04 a-b Presented below is the comparative balance sheet for Waterway Company. Waterway Company Comparative Balance Sheet As of December 31, 2021 and 2020 December 31 2021 2022 Assets Cash $180,400 $277,100 Accounts receivable (net) 220,000 156,500 Short-term investments 267,600 150,500 Inventories 1,051,400 973,400 Prepaid expenses 24,900 24,900 Plant & equipment 2,592,300 1,931,100 Accumulated depreciation (1,004,900 (753,800 $3,331,700 $2,759,700 Liabilities and Stockholders' Equity Accounts payable Accrued expenses Bonds payable Capital stock Retained earnings $50,400 169,100 453,100 2,079,500 579,600 $3,331,700...
 Problem 24-04 a-b Presented below is the comparative balance sheet for Windsor Company. Windsor Company Comparative Balance Sheet As of December 31, 2021 and 2020 December 31 2021 2022 Assets Cash $178,400 $277,400 Accounts receivable (net) 218,900 156,300 Short-term investments 271,200 151,500 Inventories 1,068,100 980,700 Prepaid expenses 25,000 25,000 Plant & equipment 2,597,900 1,964,800 Accumulated depreciation (1,008,200) (745,200) $3,351,300 $2,810,500 Liabilities and Stockholders' Equity Accounts payable Accrued expenses Bonds payable Capital stock Retained earnings $49,500 169,600 450,500 2,093,700 588,000 $3,351,300...
 Condensed financial data of Vaughn Company for 2017 and 2016 are presented below VAUGHN COMPANY COMPARATIVE BALANCE SHEET AS OF DECEMBER 31, 2017 AND 2016 Cash Receivables Inventory Plant assets Accumulated depreciation Long-term investments (held-to-maturity) 2017 $1,800 1,750 1,630 1,910 2016 $1,130 1,320 1,890 1,720 (1,190) (1,170) 1,280 $7,180 1,410 $6,300 Accounts payable Accrued liabilities Bonds payable Common stock Retained earnings $1,230 190 1,400 1,930 2,430 $7,180 $910 240 1,540 1,680 1,930 $6,300
 Question The comparative balance sheet for Earl Company is presented below: Earl Company Comparative Balance Sheet 31 December 20X8 and 20X7 20X7 $33,100 8,500 48,000 30,000 20X8 $41,000 ? Assets Cash Supplies Land 48,000 34,500 Equipment Liabilities and Equity Accounts payable Notes payable Capital stock Retained earnings $18,500 29,600 52,000 ? $21,400 28,000 52,000 35,100 Additional information for Earl's 20X8 operations revealed that the company had revenues of $68,000 for the year and no dividends were paid. Required Based on...
 Presented below is the 2018 income statement and comparative balance sheet information for Tiger Enterprises TIGER ENTERPRISES Income Statement For the Year Ended December 31, 2018 $15,000 Sales revenue Operating expenses: Cost of goods sold 5,000 Depreciation 400 960 3,400 Insurance Administrative and other Total operating expenses Income before income taxes Income tax expense Net income 9,700 5, 300 2,120 s 3,188 Balance Sheet Information ( in thousands) Dec. 31,2018 Dec. 31, 2017 Assets: Cash Accounts receivable Inventory Prepaid insurance...
 A comparative balance sheet for Rocher Company appears below ROCKER COMPANY Comparative Balance Sheet Dec 31, 2012 Dec 31, 2018 $11.000 $ 34,000 18.000 25.000 6.000 17 000 Accounts roonivable Inventory Prepaid expenses Long-term investments Equipment Accumulated depreciation Totalans 60 000 9.000 17.000 33 000 (15.000 $85.000 equipment $123.000 Liabilities and Stockholders' Equity Accounts payable $17.000 Bonds payable 30.000 Common stock 40.000 Rated earings 30.000 Totallaties and stockholders' equity $120.000 $ 7000 45.000 23.000 10.000 $85.000 Additional information 1 Net...
 Presented below is the 2018 income statement and comparative balance sheet information for Tiger Enterprises. TIGER ENTERPRISES Income Statement For the Year Ended December 31, 2018 ($ in thousands) Sales revenue $10,500 Operating expenses: Cost of goods sold $4,100 Depreciation 310 Insurance 450 Administrative and other 2,500 Total operating expenses 7, 360 Income before income taxes 3, 140 Income tax expense 1,256 Net income $ 1,884 Balance Sheet Information ($ in thousands) Dec. 31, 2018 Dec. 31, 2017 Assets: Cash...
 The comparative balance sheets for Spicer Company as of December 31 are presented below Spicer Company Comparative Balance Sheets December 31 Assets Cash Accounts receivable Inventory Prepaid expenses Land Buildings Accumulated depreciation-buildings Equipment Accumulated depreciation-equipment Total 2017 2016 $ 45,000 58,000 142,000 21,000 130,000 200,000 (40,000 ) 155,000 68,000 50,000 151,450 15,280 145,000 200,000 (60,000) 225,000 (45,000) (35,000) $749,730 $676,000 Liabilities and Stockholders Equity Accounts payable Bonds payable Common stock, $1 par Retained earnings Total $ 36,000 300,000 160,000 180,000...
Most questions answered within 3 hours.
-
Discuss why it is necessary to use repetitive statement, and use
segment codes to demonstrate your...
asked 47 seconds ago -
Need help with coming up with competitive strategies in
the furniture retail industry. Any help would...
asked 8 minutes ago -
how to select perpendicular gd&t tolerance value
using IT tolerance. and gave example
asked 15 minutes ago -
plz explain: A sound that changes pressure from 100 mPa to 10
mPa has a change...
asked 15 minutes ago -
What is the measured air concentration from a sample that has 38
μg of contaminant when...
asked 35 minutes ago -
In support of the argument that we have free will, what are the
implications of seemingly...
asked 36 minutes ago -
Share your thoughts concerning the pros and cons of using
natural products as anticancer agents. (please...
asked 45 minutes ago -
Describe in detail how your own actions reflect the
ideas shared in the discussion, and relate...
asked 50 minutes ago -
Name and clearly describe one technique for determining the age
of fossils in geological context. Are...
asked 1 hour ago -
A ball is thrown with an initial velocity of 20.0 m/s at an
angle of 35.00...
asked 57 minutes ago -
When assessing pension risk, analysts compute ratios for both
long- and short-term risk. Which statement below...
asked 56 minutes ago -
What is the relativistic momentum of a proton traveling at
0.990c?
A. 3.55E–18 kg·m/s
B. 3.52E–18...
asked 1 hour ago