Did your buffer have a larger capacity for acid or base? Why?
Homework Answers
Prepare the following table.
|
Moles acid/base added |
Δ(moles acid/base added) |
pH |
ΔpH |
|
0.00476 |
- |
6.66 |
- |
|
0.00909 |
0.00433 |
6.54 |
-0.12 |
|
0.01300 |
0.00391 |
6.41 |
-0.13 |
|
0.01670 |
0.00370 |
6.28 |
-0.13 |
|
0.02000 |
0.00330 |
6.11 |
-0.13 |
|
0.02310 |
0.00310 |
5.89 |
-0.22 |
|
0.02590 |
0.00280 |
5.56 |
-0.33 |
|
0.02860 |
0.00270 |
4.62 |
-0.94 |
|
0.00476 |
- |
6.87 |
- |
|
0.00909 |
0.00433 |
6.96 |
0.09 |
|
0.01300 |
0.00391 |
7.05 |
0.09 |
|
0.01670 |
0.00370 |
7.16 |
0.11 |
|
0.02000 |
0.00330 |
7.27 |
0.11 |
|
0.02310 |
0.00310 |
7.44 |
0.17 |
|
0.02590 |
0.00280 |
7.66 |
0.22 |
|
0.02860 |
0.00270 |
8.04 |
0.38 |
|
0.03100 |
0.00240 |
9.02 |
0.98 |
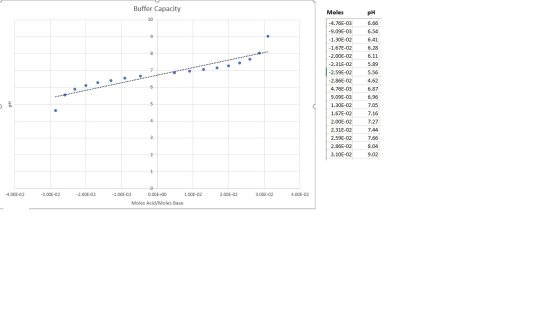
The buffer capacity of a buffer is defined as the ability of the buffer to resist changes in pH of the buffer due to addition of small amounts of a strong acid or base. The buffer depicted here shows very small variations in pH when small amounts of the strong base are added (the first six readings in the last column). Hence, the buffer has a better capacity to neutralize a strong base or the buffer has a better capacity for the strong base.
Add Answer to:
Did your buffer have a larger capacity for acid or base?
Why?
Buffer Capacity pH 6.66...
The ph range and buffer questions on photo 1 and questions 6,7, and 8 on the...
 The ph range and buffer questions on photo 1 and questions
6,7, and 8 on the last photo please!
Lab 9 Lab Report Home Insert Page Layout Formulas Data Review View Q122 x fx B C D E F G 108 5. Determine buffer capacity and the pH range of your buffer 109 Produce a graph of pH vs. molarity of acid (and base) added to the buffer. You should end up with one Igraph with molarity of acid on...
The ph range and buffer questions on photo 1 and questions
6,7, and 8 on the last photo please!
Lab 9 Lab Report Home Insert Page Layout Formulas Data Review View Q122 x fx B C D E F G 108 5. Determine buffer capacity and the pH range of your buffer 109 Produce a graph of pH vs. molarity of acid (and base) added to the buffer. You should end up with one Igraph with molarity of acid on...
Most questions answered within 3 hours.
-
Luther Corporation
Consolidated Balance Sheet
December 31, 2019 and 2018 (in $ millions)
Assets
2019
2018...
asked 40 seconds from now -
(Expected rate of return and risk) Carter Inc. is evaluating a
security. Calculate the investment’s expected...
asked 2 hours ago -
What specific indicators can point to lack of progress for
African Americans in American society?
asked 3 hours ago -
1-The Electrons in a beam are moving at 2.7×10⁸ m/s in an
electric field of 15000...
asked 3 hours ago -
A gas tank is a vertical cylinder. It has a radius of 1m, a
height of...
asked 4 hours ago -
Accent Software faces the following conditions. All of these
support Accent’s use of a market-penetration pricing...
asked 5 hours ago -
A mathematically inclined friend emails you the following
instructions: "Meet me in the cafeteria the first...
asked 5 hours ago -
A monopoly sells in two countries . The demand curves in the two
countries are p1...
asked 6 hours ago -
A .15kg rubber ball is bounced off a wall. Before hitting the
wall, the ball moves...
asked 7 hours ago -
A manufacturing company preparing to build a new plant is
considering three potential locations for it....
asked 7 hours ago -
B. If compound Y has approximately the same values of solubility
in toluene as compound X,...
asked 7 hours ago -
Oscar Inc. has inventory in Japan valued at 39,051,000 Yen one
year ago. One year ago...
asked 7 hours ago