Presented below is the condensed financial statements of Raleigh Airlines Ltd. for the year ended December...
Presented below is the condensed financial statements of Raleigh Airlines Ltd. for the year ended December 31, 2018. Consolidated Statement of Financial Position At December 31 (Stated in thousands of Canadian dollars)
|
Assets |
2018 |
2017 |
|
Current assets: |
||
|
Cash and cash equivalent |
1185806 |
1147076 |
|
Marketable securities |
93771 |
226090 |
|
Total cash, cash equivalents and marketable securities |
1279577 |
1373166 |
|
Restricted cash |
115615 |
109700 |
|
Accounts receivable |
145544 |
152492 |
|
Prepaid expenses, deposits and other |
190242 |
138676 |
|
Inventory |
39742 |
43045 |
|
1770,720 |
1817079 |
|
|
Non-current assets: |
||
|
Property and equipment |
4814200 |
4567504 |
|
Intangible assets |
54851 |
59517 |
|
Other assets |
118284 |
78584 |
|
Total assets |
6758055 |
6522684 |
|
Liabilities and shareholder’s equity |
||
|
Current liabilities: |
||
|
Accounts payable and accrued liabilities |
654422 |
546505 |
|
Unearned revenue |
695367 |
659953 |
|
Deferred rewards program |
224608 |
185991 |
|
Non-refundable guests credits |
62914 |
58575 |
|
Current portion of maintenance provisions |
101852 |
82129 |
|
Current portion of longterm debt |
536044 |
153149 |
|
2275207 |
1686302 |
|
|
Non current liabilities: |
||
|
Maintenance provisions |
278898 |
270347 |
|
Long-term debt |
1442913 |
1895898 |
|
Other liabilities |
33512 |
19171 |
|
Deferred income tax |
424958 |
392111 |
|
Total liabilities |
4455488 |
4263829 |
|
Shareholder’s equity: |
||
|
Share capital |
548979 |
548977 |
|
Equity reserves |
106655 |
97514 |
|
Hedge reserves |
6856 |
(1902) |
|
Retained earnings |
1640077 |
1614266 |
|
Total shareholder’s equity |
2302567 |
2258855 |
|
Total liabilities and shareholder’s equity |
6758055 |
6522684 |
The net income for 2018 and 2017 were $91,465 and $279,058 respectively.
1. Why is the liabilities section of the statement of financial position of primary significance to bankers, creditors and other users of the financial statements? (3 marks)
2. The accountant, in analysing the Statement of Financial Position, observed that the unearned revenue has increased in the current year when compared to the prior year. Is this a positive or negative indicator about the company’s liquidity? Explain. (3 marks)
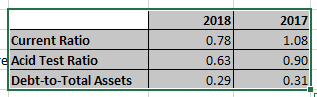
3. Evaluate the company’s liquidity and financial flexibility by calculating and analysing the following ratios for the two year period. (i) Current ratio
(ii) Acid Test Ratio
(iii) Deb-to-total Assets
(iv) Rate of return on Assets (8 marks)
Homework Answers
1. Liablity section is of much more importance to the fiancial analysts OR to the Bankers or to the users of Financial Statements. Liabilities tell a deep story of how a company finances, plans and accounts for money it will need to pay at a future date.
In the world of accounting, a liability is an obligation but is more defined by previous business transactions, events, sales, exchange of assets or services, or anything that would provide economic benefit at a later date.
Liablities section tells us about the future economic conditon of the company. It tells about the shareholders equity and also the future position of the company. Most of the ratios are calculated based on the liablities of the company. Also the liablities tells us that how much would be the outflow of funds of the company in the coming future.
2. Increase in the unearned revenue, whether Good OR Bad? It depends, upon various factors.
If the unearned revenue is increasing, and the company is delivering its services at some point of time in future without any fault, then it can be considered as good. However, if the company lacs in delivering the same at some future point of time, then it will become a matter of concern and it will not be a good sign for the company growth.
As, the unearned revenue, is a part of current liablities, that company need to incur. So to decide about the worthiness of the same, it can be said that. the Unearned Revenue is good, if the company is meeting out its liablity without any fault, because it will anyhow increaes the liquidity of the company. Otherwise, if the company is not meeting its liablility on time, then it will be a matter of concern for the companys long term existence.
3. Current Ratio = Current Assets / Current Liablities
Acid Test Ratio = (Cash & Cash Eq.+Marketable Securities + Accounts Receivable) / Current Liablities
Debt-to-Total Assets = Total Debts / Total Assets
Rate of Return on Assets = Net Income / Total Assets. (Cannot be calculated as the information of Net Income is Not Avaliable) However the formula has been provided for the same.
Add Answer to:
Presented below is the condensed financial statements of Raleigh
Airlines Ltd. for the year ended December...
Presented below is the condensed financial statements of Raleigh Airlines Ltd. for the year ended December...
Presented below is the condensed financial statements of Raleigh Airlines Ltd. for the year ended December 31, 2018. Consolidated Statement of Financial Position At December 31 (Stated in thousands of Canadian dollars) 2018 2017 Assets Currents Assets: Cash and Cash Equivalents 1185806 1147076 Marketable Securities 93771 226090 Total cash,cash equivalents and marketable securities 1279577 13732166 Restricted Cash 115615 109700 Accounts Receivable 145544 152492 Prepaid Expenses,Deposits and other 190242 138676 Inventory 39742 43045 1770720 1817079 Non Current Assets Property and Equipment...
The draft statement of financial position of Linfield Limited for the year ended 31 December 2016 are as below:...
 The draft statement of financial position of Linfield Limited for the year ended 31 December 2016 are as below: Statement of financial position as at 31 December 2016 (with comparative figures) 2016 2015 Non-current assets Property, plant and equipment 35,750 281,000 Investment properties 7,000 7,500 Intangibles assets 6,000 6,200 49,250 294,200 Current assets Inventories 3,980 4,545 Trade receivables 7,410 9,075 Short-term investments 500 Cash and bank 7,555 13,650 26,105 20,610 14,810 375,355 Total assets Equity and reserves Share capital 54,500...
The financial statements of Ivanhoe Inc. are presented here: IVANHOE INC. Income Statement Year Ended December...
The financial statements of Ivanhoe Inc. are presented here: IVANHOE INC. Income Statement Year Ended December 31, 2018 Service revenue $2,177,500 Expenses Operating expenses $1,880,500 Interest expense 100,000 1,980,500 Income before income tax 197,000 Income tax expense 39,000 Net income $158,000 IVANHOE INC. Statement of Financial Position December 31, 2018 Assets Current assets Cash $ 63,100 Held for trading investments 54,000 Accounts receivable 265,800 Supplies 28,000 $ 410,900 Property, plant, and equipment 579,300 Total assets $990,200 Liabilities and Shareholders’ Equity...
ABC Ltd has provided the following information: Income Statement for the year ended 30 June 2018...
 ABC Ltd has provided the following information: Income Statement for the year ended 30 June 2018 $000 Revenue 25460 Cost of Sales 9810 Gross Profit 15650 Depreciation 7860 Other Expenses 1080 Gain on disposal of Non Current assets 150 6860 Operating Profit Finance Charges 2250 Profit before Tax 4610 Taxation 1030 Profit for the year 3580 Statement of Changes in Equity for the year ended 30 June 2018 Retained Earnings 01.07.17 8210 Profit for the year 3580 11790 Dividends paid...
Condensed statement of financial position and income statement data for Elkhardt Ltd. are shown below: ELKHARDT...
 Condensed statement of financial position and income statement
data for Elkhardt Ltd. are shown below:
ELKHARDT
LTD.
Statement of Financial Position
December 31
(in thousands)
2018
2017
2016
Assets
Current assets
Cash
$29
$79
$199
Accounts receivable
898
706
502
Inventory
1,198
798
498
Total current assets
2,125
1,583
1,199
Property, plant, and equipment (net)
4,124
3,777
3,168
Total assets
$6,249
$5,360
$4,367
Liabilities and
Shareholders’ Equity
Liabilities
Current
liabilities
$600
$547
$502
Non-current
liabilities
3,044
2,307
1,505
Total liabilities...
Condensed statement of financial position and income statement
data for Elkhardt Ltd. are shown below:
ELKHARDT
LTD.
Statement of Financial Position
December 31
(in thousands)
2018
2017
2016
Assets
Current assets
Cash
$29
$79
$199
Accounts receivable
898
706
502
Inventory
1,198
798
498
Total current assets
2,125
1,583
1,199
Property, plant, and equipment (net)
4,124
3,777
3,168
Total assets
$6,249
$5,360
$4,367
Liabilities and
Shareholders’ Equity
Liabilities
Current
liabilities
$600
$547
$502
Non-current
liabilities
3,044
2,307
1,505
Total liabilities...
Orange Ltd., a publicly traded company, has compiled their comparative Statement of Financial Position as follows...
Orange Ltd., a publicly traded company, has compiled their comparative Statement of Financial Position as follows for their December 31, 20X8 year-end. Orange Ltd Comparative Statement of Financial Position As at December 31, 20X8 20X8 20X7 Assets Current Assets Cash 42,485 22,000 Accounts receivable 163,794 181,000 Inventory 23,000 229,297 53,000 256,000 Non-current assets PP&E (net) 759,600 446,000 Patents 80,000 839,600 87,000 295,000 Total Assets 1,068,897 507,000 Liabilities and Equity Current liabilities Accounts payable...
Use the financial statements provided below to answer Question 4. Happy Manufacturing Ltd Statement of Financial...
 Use the financial statements provided below to answer Question 4. Happy Manufacturing Ltd Statement of Financial Position as at 30 June 2019 Current Assets 2019 Cash at bank 52,800 Accounts receivable 41,600 Inventory 24,000 Pre-Paid rent 750 Total Current Assets 119,150 Non-Current Assets PPE 50,000 Accumulated depreciation: PPE - 16,000 Total Non-current Assets 34,000 Total ASSETS $ 153,150 $ 2018 33,000 34,000 15,000 500 82,500 50,000 -8,000 42,000 124,500 24,000 8,000 32,000 Liabilities Accounts payable 21,000 Salaries & Wages payable...
Condensed statement of financial position and income statement data for Elkhardt Ltd. are shown below: ELKHARDT...
 Condensed statement of financial position and income statement
data for Elkhardt Ltd. are shown below:
ELKHARDT
LTD.
Statement of Financial Position
December 31
(in thousands)
2018
2017
2016
Assets
Current assets
Cash
$29
$79
$199
Accounts receivable
898
706
502
Inventory
1,198
798
498
Total current assets
2,125
1,583
1,199
Property, plant, and equipment (net)
4,124
3,777
3,168
Total assets
$6,249
$5,360
$4,367
Liabilities and
Shareholders’ Equity
Liabilities
Current
liabilities
$600
$547
$502
Non-current
liabilities
3,044
2,307
1,505
Total liabilities...
Condensed statement of financial position and income statement
data for Elkhardt Ltd. are shown below:
ELKHARDT
LTD.
Statement of Financial Position
December 31
(in thousands)
2018
2017
2016
Assets
Current assets
Cash
$29
$79
$199
Accounts receivable
898
706
502
Inventory
1,198
798
498
Total current assets
2,125
1,583
1,199
Property, plant, and equipment (net)
4,124
3,777
3,168
Total assets
$6,249
$5,360
$4,367
Liabilities and
Shareholders’ Equity
Liabilities
Current
liabilities
$600
$547
$502
Non-current
liabilities
3,044
2,307
1,505
Total liabilities...
The comparative statements of financial position for the years 2017 and 2018 and a summarized income...
 The comparative statements of financial position for the years 2017 and 2018 and a summarized income statement for the year ending 2018 of Genie Marketing Pte Ltd are shown below. Genie had no non-cash financing and investing transactions during 2018. During the year, there were no sales of land or machinery. Genie Marketing Pte Ltd Comparative Statements of Financial Position 31 December 2018 2017 $ 21,000 $ 18,700 46,500 43,100 84,300 89,900 10,000 35,100 146,200 123,700 (30,000) (45,300) $287,800 $255,400...
Tailoka's summarized financial statements for the year ended 31 March 2019 are sol out below K...
 Tailoka's summarized financial statements for the year ended 31 March 2019 are sol out below K million 4,000 (3,450) 550 (370) 40 180 Statement of Profit Or Loss Revenue (25% cash sales) Cost of sales Gross profit Operating experises Profit on disposal of plant Finance charges Profit before tax Income tax expense Profit for the period Dividend paid Retained profit for the year (20) 200 (50) 150 50 100 K'million K million 550 Statement of Financial Position Non-current assets Property,...
 The draft statement of financial position of Linfield Limited for the year ended 31 December 2016 are as below: Statement of financial position as at 31 December 2016 (with comparative figures) 2016 2015 Non-current assets Property, plant and equipment 35,750 281,000 Investment properties 7,000 7,500 Intangibles assets 6,000 6,200 49,250 294,200 Current assets Inventories 3,980 4,545 Trade receivables 7,410 9,075 Short-term investments 500 Cash and bank 7,555 13,650 26,105 20,610 14,810 375,355 Total assets Equity and reserves Share capital 54,500...
 ABC Ltd has provided the following information: Income Statement for the year ended 30 June 2018 $000 Revenue 25460 Cost of Sales 9810 Gross Profit 15650 Depreciation 7860 Other Expenses 1080 Gain on disposal of Non Current assets 150 6860 Operating Profit Finance Charges 2250 Profit before Tax 4610 Taxation 1030 Profit for the year 3580 Statement of Changes in Equity for the year ended 30 June 2018 Retained Earnings 01.07.17 8210 Profit for the year 3580 11790 Dividends paid...
 Condensed statement of financial position and income statement
data for Elkhardt Ltd. are shown below:
ELKHARDT
LTD.
Statement of Financial Position
December 31
(in thousands)
2018
2017
2016
Assets
Current assets
Cash
$29
$79
$199
Accounts receivable
898
706
502
Inventory
1,198
798
498
Total current assets
2,125
1,583
1,199
Property, plant, and equipment (net)
4,124
3,777
3,168
Total assets
$6,249
$5,360
$4,367
Liabilities and
Shareholders’ Equity
Liabilities
Current
liabilities
$600
$547
$502
Non-current
liabilities
3,044
2,307
1,505
Total liabilities...
Condensed statement of financial position and income statement
data for Elkhardt Ltd. are shown below:
ELKHARDT
LTD.
Statement of Financial Position
December 31
(in thousands)
2018
2017
2016
Assets
Current assets
Cash
$29
$79
$199
Accounts receivable
898
706
502
Inventory
1,198
798
498
Total current assets
2,125
1,583
1,199
Property, plant, and equipment (net)
4,124
3,777
3,168
Total assets
$6,249
$5,360
$4,367
Liabilities and
Shareholders’ Equity
Liabilities
Current
liabilities
$600
$547
$502
Non-current
liabilities
3,044
2,307
1,505
Total liabilities...
 Use the financial statements provided below to answer Question 4. Happy Manufacturing Ltd Statement of Financial Position as at 30 June 2019 Current Assets 2019 Cash at bank 52,800 Accounts receivable 41,600 Inventory 24,000 Pre-Paid rent 750 Total Current Assets 119,150 Non-Current Assets PPE 50,000 Accumulated depreciation: PPE - 16,000 Total Non-current Assets 34,000 Total ASSETS $ 153,150 $ 2018 33,000 34,000 15,000 500 82,500 50,000 -8,000 42,000 124,500 24,000 8,000 32,000 Liabilities Accounts payable 21,000 Salaries & Wages payable...
 Condensed statement of financial position and income statement
data for Elkhardt Ltd. are shown below:
ELKHARDT
LTD.
Statement of Financial Position
December 31
(in thousands)
2018
2017
2016
Assets
Current assets
Cash
$29
$79
$199
Accounts receivable
898
706
502
Inventory
1,198
798
498
Total current assets
2,125
1,583
1,199
Property, plant, and equipment (net)
4,124
3,777
3,168
Total assets
$6,249
$5,360
$4,367
Liabilities and
Shareholders’ Equity
Liabilities
Current
liabilities
$600
$547
$502
Non-current
liabilities
3,044
2,307
1,505
Total liabilities...
Condensed statement of financial position and income statement
data for Elkhardt Ltd. are shown below:
ELKHARDT
LTD.
Statement of Financial Position
December 31
(in thousands)
2018
2017
2016
Assets
Current assets
Cash
$29
$79
$199
Accounts receivable
898
706
502
Inventory
1,198
798
498
Total current assets
2,125
1,583
1,199
Property, plant, and equipment (net)
4,124
3,777
3,168
Total assets
$6,249
$5,360
$4,367
Liabilities and
Shareholders’ Equity
Liabilities
Current
liabilities
$600
$547
$502
Non-current
liabilities
3,044
2,307
1,505
Total liabilities...
 The comparative statements of financial position for the years 2017 and 2018 and a summarized income statement for the year ending 2018 of Genie Marketing Pte Ltd are shown below. Genie had no non-cash financing and investing transactions during 2018. During the year, there were no sales of land or machinery. Genie Marketing Pte Ltd Comparative Statements of Financial Position 31 December 2018 2017 $ 21,000 $ 18,700 46,500 43,100 84,300 89,900 10,000 35,100 146,200 123,700 (30,000) (45,300) $287,800 $255,400...
 Tailoka's summarized financial statements for the year ended 31 March 2019 are sol out below K million 4,000 (3,450) 550 (370) 40 180 Statement of Profit Or Loss Revenue (25% cash sales) Cost of sales Gross profit Operating experises Profit on disposal of plant Finance charges Profit before tax Income tax expense Profit for the period Dividend paid Retained profit for the year (20) 200 (50) 150 50 100 K'million K million 550 Statement of Financial Position Non-current assets Property,...
Most questions answered within 3 hours.
-
Work of 1950 J is done by stirring a perfectly insulated beaker
containing 75 g of...
asked 28 minutes ago -
The neighborhood kids set up an outdoor lemonade stand in
Maryland in June. They find that...
asked 29 minutes ago -
9. A company has a beginning inventory of 4,000 units. The
company estimates it will sell...
asked 43 minutes ago -
A patient goes to the doctor's office with symptoms of a urinary
tract infection and provides...
asked 45 minutes ago -
When responding to the essay questions, be sure to cite any
material you obtained from a...
asked 45 minutes ago -
The energy of an electron in a 2.25-eV-deep potential well is
1.50 eV.At what distance into...
asked 47 minutes ago -
Q1:Which three evolutionary innovations are present in land
plants (but not all land plants) that allowed...
asked 49 minutes ago -
Lymphosarcoma is
extremely rare. Risk factors for the disease are largely unknown.
What kind of study...
asked 52 minutes ago -
The solubility of benzoic acid in water is:
0.29g/100mL at 20°C
6.8g/100mL at 100°C
a) What...
asked 53 minutes ago -
Which food law was passed in 1996 and changed how pesticide
residues on food were regulated...
asked 1 hour ago -
companies either hire outside programmers to
write_____ software or use their own internal developers.
asked 1 hour ago -
A magnetic dipole m(t) = m_0*cos(ωt) can be
described as current density j(r,t) = −cm(t) ×...
asked 1 hour ago