

Homework Answers
a)
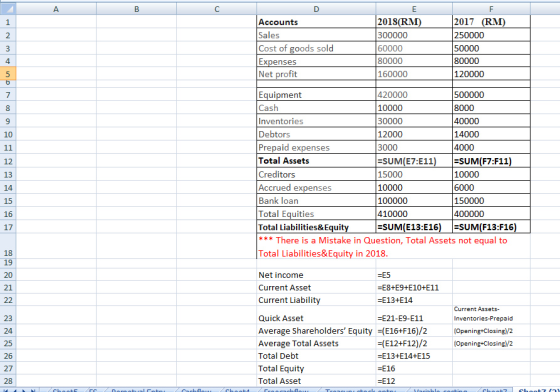
| i | Current ratio | 2.2 | Current Asset/ Current Liability |
| ii | Quick ratio | 0.88 | Quick Asset/ Current Liability |
| iii | Return on Equity | 39.51% | Net
Income/ Average Shareholders’ Equity *100 |
| iv | Return on Asset | 30.74% | Net Income/ Average Total Assets *100 |
| v | Debt to Equity ratio | 30.49% | Total Debt/ Total Equity *100 |
| vi | Debt to Asset ratio | 26.32% | Total Debt/ Total Assets *100 |
-
Formula:

-
b)
| MM Enterprise | Industry Average | |
| Current ratio | 2.2 | 2.8 |
| Return on Equity | 39.51% | 30% |
| Return on Asset | 30.74% | -25% |
| Debt to Asset ratio | 26.32% | 30% |
-
| Compared to industry average MM Enterprise has:- |
| Lower current ratio, but still they have a better ratio, they can easily meet its current obligations |
| Higher rate of return on equity than industry average |
| Higher rate of return on asset than industry average |
| Lower Debt to asset ratio, it means MM Enterprise's bulk of asset funding is coming from equity when compared to industry average. |
--
Hope you Understood.
If you have any doubt please leave a comment.
Thank you.
Add Answer to:
The following are the comparative accounts for MM Enterprise for the financial year 2018 and 2017:...
3. The following information is for the year 2018 for ABC and XYZ, which are in...
 3. The following information is for the year 2018 for ABC and XYZ, which are in the same industry. ABC XYZ RM RM Current assets 20,000 75,000 Non-current assets 40,000 140,000 Current liabilities 8,000 60,000 Non-current liabilities 20,000 130,000 Sales 200,000 850,000 Net income 4,000 10,000 (a) Compute the following: (i) Current ratio (ii) Debt ratio (iii) Return on sales (iv) Asset turnover (v) Return on equity (b) Give a brief explanation of the interpretation of the above calculated ratios.
Financial Indicators/Ratios 2018 2017 Current ratio ? 2.92 : 1 Acid test ratio ? 1.28 :...
Financial Indicators/Ratios 2018 2017 Current ratio ? 2.92 : 1 Acid test ratio ? 1.28 : 1 Debtors collection period ? 16 days Creditors payment period ? 27 days Inventory turnover rate ? 24 times/year Gross profit percentage ? 35% Net profit percentage ? 10,29% Return on equity ? 210,53% Debt equity ratio ? 0.74 Catwalksale (Pty) Ltd Extract from the statement of profit or loss and other comprehensive income for the year ending 31 December 2018: 2018 2017 Revenue...
2018 $ 154 2017 $ 198 448 547 $ 1,193 423 630 1,207 $ Cash Accounts...
 2018 $ 154 2017 $ 198 448 547 $ 1,193 423 630 1,207 $ Cash Accounts receivable Inventory Current assets Plant and equipment Less accumulated depreciation Net plant and equipment Total assets $ 2,205 (1,001) $ 2,604 (1,198) $ 1,204 $ 2,397 $ 1,406 $ 2,613 $ 149 198 0 198 $ $ 152 301 596 897 $ 794 $ LIABILITIES AND OWNERS' EQUITY Accounts payable Notes payable current (9.00% interest) Current liabilities Bonds (8.33% interest) Total debt Owners' equity...
QUESTION 3 From following financial statements, calculate following ratios and analyse the current year and previous...
 QUESTION 3 From following financial statements, calculate following ratios and analyse the current year and previous year performance a) Current ratio. b) Days sales outstanding (DSO). (Sales 2017 RM500m & Sales 2018 RM600m) c) Inventory turnover ratio d) Total debt to assets e) Return on assets (ROA) (Net income 2017 RM42m &Net income 2018 RM58m) Moon Inc. Balance Sheet (RM millions) as at December 31, 2015 and 2016 2015 21 51 2016 20 84 Cash Accounts receivable Inventory Prepaid expenses...
Just Dew It Corporation reports the following balance sheet information for 2017 and 2018 ook $...
 Just Dew It Corporation reports the following balance sheet information for 2017 and 2018 ook $ 73,750 $ 63,750 rences JUST DEW IT CORPORATION 2017 and 2018 Balance Sheets Assets Liabilities and Owners' Equity 2017 2018 2017 2018 Current assets Current liabilities $ 10,500 $10.450 Cash Accounts payable 28,250 Accounts receivable 28,600 Notes payable 50,000 49,750 $ 123,750 $ 113,500 Inventory 64,300 63,500 Total $ 103,050 $ 102,550 $ 63,600 $ 64,600 Total Long-term debt Owners' equity Common stock and...
Some recent financial statements for Earl Grey Golf Corp. follow. Assets 2018 Current assets Cash Accounts...
 Some recent financial statements for Earl Grey Golf Corp. follow. Assets 2018 Current assets Cash Accounts receivable Inventory Total EARL GREY GOLF CORP. 2017 and 2018 Statement of Financial Position Liabilities and Owners' Equity 2017 2018 2017 Current liabilities $ 24,046 $ 24,255 Accounts payable $ 23,184 12,448 15, 235 Notes payable 12,000 25,392 27,155 Other 11,571 $ 61,886 $ 66,645 Total $ 46,755 Long-term debt $ 80,000 Owners' equity $324,695 $365,734 Common stock and paid-in surplus $ 40,000 Retained...
Some recent financial statements for Smolira Golf Corp. follow SMOLIRA GOLF CORP 2017 and 2018 Balance...
 Some recent financial statements for Smolira Golf Corp. follow SMOLIRA GOLF CORP 2017 and 2018 Balance Sheets Assets Liabilities and Owners' Equity 2017 2018 2017 2018 Current assets Current liabilities $ 24,116 24,800 15,900 27,800 63,656 68,500 $23,884 27,800 11,500 15,700 $53,155 55,000 $76,000 80,259 Cash Accounts 13,148 26,392 Accounts payable Notes payable Other 17,000 receivable Inventory 12,271 Total Total Long-term debt Owners' equity Common stock and paid-in $40,000 40,00o surplus Accumulated retained 226,196 258,741 earnings Fixed assets Net plant...
Some recent financial statements for Smolira Golf Corp. follow SMOLIRA GOLF CORP 2017 and 2018 Balance...
 Some recent financial statements for Smolira Golf Corp. follow SMOLIRA GOLF CORP 2017 and 2018 Balance Sheets Assets Liabilities and Owners' Equity 2017 2018 2017 2018 Current assets Current liabilities Cash $ 24,056 24,200 15,300 27,200 $ 62,196 $66,700 $ 23,284 $ 27,200 10,900 15,900 $ 46,955 54,000 90,000 93,294 Accounts Inventory Total Accounts payable Notes payable Other 12,548 12,000 receivable 25,592 11,671 Total Long-term debt Owners' equity Common stock and paid-in $42,000 42,000 surplus Accumulated retained 208,936 242,706 earnings...
The following financial statements apply to Karl Company: Calculate the following ratios for 2018 and 2019....
 The following financial statements apply to Karl Company:
Calculate the following ratios for 2018 and 2019. Since 2017
numbers are not presented, do not use averages when calculating the
ratios for 2018. Instead, use the number presented on the 2018
balance sheet.
2019 2018 $420,000 16,000 436,000 $350,000 10,000 360,000 252,000 42,000 22,000 6,000 42,000 364,000 $ 72,000 206,000 38,000 20,000 6,000 36,000 306,000 $ 54,000 Revenues Net sales Other revenues Total revenues Expenses Cost of goods sold Selling expenses...
The following financial statements apply to Karl Company:
Calculate the following ratios for 2018 and 2019. Since 2017
numbers are not presented, do not use averages when calculating the
ratios for 2018. Instead, use the number presented on the 2018
balance sheet.
2019 2018 $420,000 16,000 436,000 $350,000 10,000 360,000 252,000 42,000 22,000 6,000 42,000 364,000 $ 72,000 206,000 38,000 20,000 6,000 36,000 306,000 $ 54,000 Revenues Net sales Other revenues Total revenues Expenses Cost of goods sold Selling expenses...
 3. The following information is for the year 2018 for ABC and XYZ, which are in the same industry. ABC XYZ RM RM Current assets 20,000 75,000 Non-current assets 40,000 140,000 Current liabilities 8,000 60,000 Non-current liabilities 20,000 130,000 Sales 200,000 850,000 Net income 4,000 10,000 (a) Compute the following: (i) Current ratio (ii) Debt ratio (iii) Return on sales (iv) Asset turnover (v) Return on equity (b) Give a brief explanation of the interpretation of the above calculated ratios.
 2018 $ 154 2017 $ 198 448 547 $ 1,193 423 630 1,207 $ Cash Accounts receivable Inventory Current assets Plant and equipment Less accumulated depreciation Net plant and equipment Total assets $ 2,205 (1,001) $ 2,604 (1,198) $ 1,204 $ 2,397 $ 1,406 $ 2,613 $ 149 198 0 198 $ $ 152 301 596 897 $ 794 $ LIABILITIES AND OWNERS' EQUITY Accounts payable Notes payable current (9.00% interest) Current liabilities Bonds (8.33% interest) Total debt Owners' equity...
 QUESTION 3 From following financial statements, calculate following ratios and analyse the current year and previous year performance a) Current ratio. b) Days sales outstanding (DSO). (Sales 2017 RM500m & Sales 2018 RM600m) c) Inventory turnover ratio d) Total debt to assets e) Return on assets (ROA) (Net income 2017 RM42m &Net income 2018 RM58m) Moon Inc. Balance Sheet (RM millions) as at December 31, 2015 and 2016 2015 21 51 2016 20 84 Cash Accounts receivable Inventory Prepaid expenses...
 Just Dew It Corporation reports the following balance sheet information for 2017 and 2018 ook $ 73,750 $ 63,750 rences JUST DEW IT CORPORATION 2017 and 2018 Balance Sheets Assets Liabilities and Owners' Equity 2017 2018 2017 2018 Current assets Current liabilities $ 10,500 $10.450 Cash Accounts payable 28,250 Accounts receivable 28,600 Notes payable 50,000 49,750 $ 123,750 $ 113,500 Inventory 64,300 63,500 Total $ 103,050 $ 102,550 $ 63,600 $ 64,600 Total Long-term debt Owners' equity Common stock and...
 Some recent financial statements for Earl Grey Golf Corp. follow. Assets 2018 Current assets Cash Accounts receivable Inventory Total EARL GREY GOLF CORP. 2017 and 2018 Statement of Financial Position Liabilities and Owners' Equity 2017 2018 2017 Current liabilities $ 24,046 $ 24,255 Accounts payable $ 23,184 12,448 15, 235 Notes payable 12,000 25,392 27,155 Other 11,571 $ 61,886 $ 66,645 Total $ 46,755 Long-term debt $ 80,000 Owners' equity $324,695 $365,734 Common stock and paid-in surplus $ 40,000 Retained...
 Some recent financial statements for Smolira Golf Corp. follow SMOLIRA GOLF CORP 2017 and 2018 Balance Sheets Assets Liabilities and Owners' Equity 2017 2018 2017 2018 Current assets Current liabilities $ 24,116 24,800 15,900 27,800 63,656 68,500 $23,884 27,800 11,500 15,700 $53,155 55,000 $76,000 80,259 Cash Accounts 13,148 26,392 Accounts payable Notes payable Other 17,000 receivable Inventory 12,271 Total Total Long-term debt Owners' equity Common stock and paid-in $40,000 40,00o surplus Accumulated retained 226,196 258,741 earnings Fixed assets Net plant...
 Some recent financial statements for Smolira Golf Corp. follow SMOLIRA GOLF CORP 2017 and 2018 Balance Sheets Assets Liabilities and Owners' Equity 2017 2018 2017 2018 Current assets Current liabilities Cash $ 24,056 24,200 15,300 27,200 $ 62,196 $66,700 $ 23,284 $ 27,200 10,900 15,900 $ 46,955 54,000 90,000 93,294 Accounts Inventory Total Accounts payable Notes payable Other 12,548 12,000 receivable 25,592 11,671 Total Long-term debt Owners' equity Common stock and paid-in $42,000 42,000 surplus Accumulated retained 208,936 242,706 earnings...
 Some recent financial statements for Smolira Golf Corp. follow SMOLIRA GOLF CORP 2017 and 2018 Balance Sheets Assets Liabilities and Owners' Equity 2017 2018 2017 2018 Current assets Current liabilities Cash $ 24,056 24,200 15,300 27,200 $ 62,196 $66,700 $ 23,284 $ 27,200 10,900 15,900 $ 46,955 54,000 90,000 93,294 Accounts Inventory Total Accounts payable Notes payable Other 12,548 12,000 receivable 25,592 11,671 Total Long-term debt Owners' equity Common stock and paid-in $42,000 42,000 surplus Accumulated retained 208,936 242,706 earnings...
 The following financial statements apply to Karl Company:
Calculate the following ratios for 2018 and 2019. Since 2017
numbers are not presented, do not use averages when calculating the
ratios for 2018. Instead, use the number presented on the 2018
balance sheet.
2019 2018 $420,000 16,000 436,000 $350,000 10,000 360,000 252,000 42,000 22,000 6,000 42,000 364,000 $ 72,000 206,000 38,000 20,000 6,000 36,000 306,000 $ 54,000 Revenues Net sales Other revenues Total revenues Expenses Cost of goods sold Selling expenses...
The following financial statements apply to Karl Company:
Calculate the following ratios for 2018 and 2019. Since 2017
numbers are not presented, do not use averages when calculating the
ratios for 2018. Instead, use the number presented on the 2018
balance sheet.
2019 2018 $420,000 16,000 436,000 $350,000 10,000 360,000 252,000 42,000 22,000 6,000 42,000 364,000 $ 72,000 206,000 38,000 20,000 6,000 36,000 306,000 $ 54,000 Revenues Net sales Other revenues Total revenues Expenses Cost of goods sold Selling expenses...
Most questions answered within 3 hours.
-
Calculate the pH of each of the following solutions.
0.50 M HBr
3.1×10⁻⁴ M KOH
4.2×10⁻⁵...
asked 1 hour ago -
For the year ended December 31, Depot Max’s cost of merchandise
sold was $85,600. Inventory at the...
asked 1 hour ago -
Week 10 - Professional Memo Assignment
Professional Memo Assignment
Your mission for this week, should you...
asked 1 hour ago -
Write a Python program that stores the data for each
player on the team, and it...
asked 1 hour ago -
In
the last 3 months, mike never knows when he is going to get his
allowance...
asked 2 hours ago -
Is Ca(OH)2 a Bronsted base, Lewis base, or both? Why?
asked 1 hour ago -
1A- Why don’t voters complain about U.S. tariffs on imported
sugar?
Because sugar is only a...
asked 2 hours ago -
Cash Payback Period
Primera Banco is evaluating two capital investment proposals for
a drive-up ATM kiosk,...
asked 2 hours ago -
Create a button in Swift (Xcode) that will create a charge,
create a charge using Stripe's...
asked 2 hours ago -
The reaction rate of CO and NO2 in the reaction
CO(g) + NO2(g) → CO2(g) +...
asked 2 hours ago -
Imagine that a chemist puts 6.40 mol each of
C3H8 and O2 in a 1.00-L container...
asked 2 hours ago -
How much money should be invested today in order to have $8340
at the end of...
asked 2 hours ago