


Homework Answers


Add Answer to:
Problem for Chapter 13 Analyzing Financial Statements Information below comes from the financial statements of Rosson...
Using the financial statements for the Snider Corporation, calculate the 13 basic ratios found in the...
 Using the financial statements for the Snider Corporation, calculate the 13 basic ratios found in the chapter SNIDER CORPORATION Balance Sheet December 31, 20X1 Assets Current assets Cash Marketable securities Accounts receivable (net) Inventory $ 52,900 23,700 213,000 233,000 $522,600 64,500 Total current assets Investments Plant and equipment $612,000 246,000 Less: Accumulated depreciation Net plant and equipment 366,000 $ 953,100 Total assets Liabilities and Stockholders' Equity Current liabilities: Accounts payable Notes payable Accrued taxes $ 94,700 78,000 13,900 $ 186,600...
Using the financial statements for the Snider Corporation, calculate the 13 basic ratios found in the chapter SNIDER CO...
 Using the financial statements for the Snider Corporation, calculate the 13 basic ratios found in the chapter SNIDER CORPORATION Balance Sheet December 31, 20X1 Assets Current assets Cash Marketable securitie $ 51,800 24,200 Accounts receivable (net Inventory Total current assets 174,000 227,000 $ 477,000 63,500 Investments Plant and equipment Less: Accumulated depreciation Net plant and equipment $646,000 246,000 400,000 $ 940,500 Total assets Liabilities and Stockholders' Equity Current liabilities Accounts payable Notes payable Accrued taxes $ 91,100 73,400 18,400 Total...
Problem 13-2A The comparative statements of Blossom Company are presented here. BLOSSOM COMPANY Income Statements For...
Problem 13-2A The comparative statements of Blossom Company are presented here. BLOSSOM COMPANY Income Statements For the Years Ended December 31 2017 2016 Net sales $1,893,340 $1,753,300 Cost of goods sold 1,061,340 1,008,800 Gross profit 832,000 744,500 Selling and administrative expenses 502,800 481,800 Income from operations 329,200 262,700 Other expenses and losses Interest expense 23,700 21,700 Income before income taxes 305,500 241,000 Income tax expense 93,700 74,700 Net income $ 211,800 $ 166,300 BLOSSOM COMPANY Balance Sheets December 31 Assets...
can someone help me for the question S . the last qustion thank you Financial statements...
 can someone help me for the question S . the last
qustion
thank you
Financial statements for Fanning Company follow FANNING COMPANY Balance Sheets As of December 31 2019 2018 25.000 241,000 208.000 280,000 31,000 $584 000 26.000 $524 000 $ Current assets Cash Marketable securities Accounts receivable net) Inventories Prepaid items Total current assets Investments Plant (net) Land Total assets Liabilities and Stockholders' Equity Liabilities Current liable Notes payable Accounts payable Salaries payable Total current a s Noncurrenties Bonds...
can someone help me for the question S . the last
qustion
thank you
Financial statements for Fanning Company follow FANNING COMPANY Balance Sheets As of December 31 2019 2018 25.000 241,000 208.000 280,000 31,000 $584 000 26.000 $524 000 $ Current assets Cash Marketable securities Accounts receivable net) Inventories Prepaid items Total current assets Investments Plant (net) Land Total assets Liabilities and Stockholders' Equity Liabilities Current liable Notes payable Accounts payable Salaries payable Total current a s Noncurrenties Bonds...
can someone help me with M and N please thank you Financial statements for Fanning Company...
 can someone help me with M and N please
thank you
Financial statements for Fanning Company follow FANNING COMPANY Balance Sheets As of December 31 2019 2018 25.000 241,000 208.000 280,000 31,000 $584 000 26.000 $524 000 $ Current assets Cash Marketable securities Accounts receivable net) Inventories Prepaid items Total current assets Investments Plant (net) Land Total assets Liabilities and Stockholders' Equity Liabilities Current liable Notes payable Accounts payable Salaries payable Total current a s Noncurrenties Bonds payable Other Total...
can someone help me with M and N please
thank you
Financial statements for Fanning Company follow FANNING COMPANY Balance Sheets As of December 31 2019 2018 25.000 241,000 208.000 280,000 31,000 $584 000 26.000 $524 000 $ Current assets Cash Marketable securities Accounts receivable net) Inventories Prepaid items Total current assets Investments Plant (net) Land Total assets Liabilities and Stockholders' Equity Liabilities Current liable Notes payable Accounts payable Salaries payable Total current a s Noncurrenties Bonds payable Other Total...
can someone help me Financial statements for Fanning Company follow FANNING COMPANY Balance Sheets As of...
 can someone help me
Financial statements for Fanning Company follow FANNING COMPANY Balance Sheets As of December 31 2019 2018 25.000 241,000 208.000 280,000 31,000 $584 000 26.000 $524 000 $ Current assets Cash Marketable securities Accounts receivable net) Inventories Prepaid items Total current assets Investments Plant (net) Land Total assets Liabilities and Stockholders' Equity Liabilities Current liable Notes payable Accounts payable Salaries payable Total current a s Noncurrenties Bonds payable Other Total noncurrent abilities Total liabilities Stockholders' equity Preferred...
can someone help me
Financial statements for Fanning Company follow FANNING COMPANY Balance Sheets As of December 31 2019 2018 25.000 241,000 208.000 280,000 31,000 $584 000 26.000 $524 000 $ Current assets Cash Marketable securities Accounts receivable net) Inventories Prepaid items Total current assets Investments Plant (net) Land Total assets Liabilities and Stockholders' Equity Liabilities Current liable Notes payable Accounts payable Salaries payable Total current a s Noncurrenties Bonds payable Other Total noncurrent abilities Total liabilities Stockholders' equity Preferred...
can someone help me with G H I and O please Financial statements for Fanning Company...
 can someone help me with
G H I and O please
Financial statements for Fanning Company follow FANNING COMPANY Balance Sheets As of December 31 2019 2018 25.000 241,000 208.000 280,000 31,000 $584 000 26.000 $524 000 $ Current assets Cash Marketable securities Accounts receivable net) Inventories Prepaid items Total current assets Investments Plant (net) Land Total assets Liabilities and Stockholders' Equity Liabilities Current liable Notes payable Accounts payable Salaries payable Total current a s Noncurrenties Bonds payable Other Total...
can someone help me with
G H I and O please
Financial statements for Fanning Company follow FANNING COMPANY Balance Sheets As of December 31 2019 2018 25.000 241,000 208.000 280,000 31,000 $584 000 26.000 $524 000 $ Current assets Cash Marketable securities Accounts receivable net) Inventories Prepaid items Total current assets Investments Plant (net) Land Total assets Liabilities and Stockholders' Equity Liabilities Current liable Notes payable Accounts payable Salaries payable Total current a s Noncurrenties Bonds payable Other Total...
Problem 13-4A Calculation of financial statement ratios LO P3 Selected year-end financial statements of Cabot Corporation...
 Problem 13-4A Calculation of financial statement ratios LO P3 Selected year-end financial statements of Cabot Corporation follow. (All sales were on credit; selected balance sheet amounts at December 31, 2016, were inventory, $49,900; total assets, $179,400; common stock, $85,000; and retained earnings, $37,004.) CABOT CORPORATION Income Statement For Year Ended December 31, 2017 $451,600 297,850 153,750 98,800 4,300 50,650 20,404 Sales Cost of goods sold Gross profit Operating expenses Interest expense Income before taxes Income taxes $ 30,246 Net income...
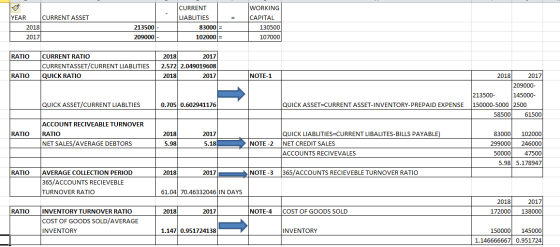
QUESTION 3 From following financial statements, calculate following ratios and analyse the current year and previous...
 QUESTION 3 From following financial statements, calculate following ratios and analyse the current year and previous year performance a) Current ratio. b) Days sales outstanding (DSO). (Sales 2017 RM500m & Sales 2018 RM600m) c) Inventory turnover ratio d) Total debt to assets e) Return on assets (ROA) (Net income 2017 RM42m &Net income 2018 RM58m) Moon Inc. Balance Sheet (RM millions) as at December 31, 2015 and 2016 2015 21 51 2016 20 84 Cash Accounts receivable Inventory Prepaid expenses...
Using the financial statements for the Snider Corporation, calculate the 13 basic ratios found in the...
Using the financial statements for the Snider Corporation, calculate the 13 basic ratios found in the chapter. MARNI CORPORATION Balance Sheet December 31, 2018 Assets Current assets: Cash $50,000 Accounts receivable 100,000 Inventory 200,000 Total current assets $350,000 Net plant and equipment $650,000 Total assets $1,000,000 Liabilities and Stockholders' Equity Current liabilities: Accounts payable $100,000 Accrued expenses 90,000 Total current liabilities $190,000 Long-term liabilities: Long-term debt: 250,000 Total liabilities $440,000 Stockholders' equity: Common stock 100,000 Capital paid in excess of...
 Using the financial statements for the Snider Corporation, calculate the 13 basic ratios found in the chapter SNIDER CORPORATION Balance Sheet December 31, 20X1 Assets Current assets Cash Marketable securities Accounts receivable (net) Inventory $ 52,900 23,700 213,000 233,000 $522,600 64,500 Total current assets Investments Plant and equipment $612,000 246,000 Less: Accumulated depreciation Net plant and equipment 366,000 $ 953,100 Total assets Liabilities and Stockholders' Equity Current liabilities: Accounts payable Notes payable Accrued taxes $ 94,700 78,000 13,900 $ 186,600...
 Using the financial statements for the Snider Corporation, calculate the 13 basic ratios found in the chapter SNIDER CORPORATION Balance Sheet December 31, 20X1 Assets Current assets Cash Marketable securitie $ 51,800 24,200 Accounts receivable (net Inventory Total current assets 174,000 227,000 $ 477,000 63,500 Investments Plant and equipment Less: Accumulated depreciation Net plant and equipment $646,000 246,000 400,000 $ 940,500 Total assets Liabilities and Stockholders' Equity Current liabilities Accounts payable Notes payable Accrued taxes $ 91,100 73,400 18,400 Total...
 can someone help me for the question S . the last
qustion
thank you
Financial statements for Fanning Company follow FANNING COMPANY Balance Sheets As of December 31 2019 2018 25.000 241,000 208.000 280,000 31,000 $584 000 26.000 $524 000 $ Current assets Cash Marketable securities Accounts receivable net) Inventories Prepaid items Total current assets Investments Plant (net) Land Total assets Liabilities and Stockholders' Equity Liabilities Current liable Notes payable Accounts payable Salaries payable Total current a s Noncurrenties Bonds...
can someone help me for the question S . the last
qustion
thank you
Financial statements for Fanning Company follow FANNING COMPANY Balance Sheets As of December 31 2019 2018 25.000 241,000 208.000 280,000 31,000 $584 000 26.000 $524 000 $ Current assets Cash Marketable securities Accounts receivable net) Inventories Prepaid items Total current assets Investments Plant (net) Land Total assets Liabilities and Stockholders' Equity Liabilities Current liable Notes payable Accounts payable Salaries payable Total current a s Noncurrenties Bonds...
 can someone help me with M and N please
thank you
Financial statements for Fanning Company follow FANNING COMPANY Balance Sheets As of December 31 2019 2018 25.000 241,000 208.000 280,000 31,000 $584 000 26.000 $524 000 $ Current assets Cash Marketable securities Accounts receivable net) Inventories Prepaid items Total current assets Investments Plant (net) Land Total assets Liabilities and Stockholders' Equity Liabilities Current liable Notes payable Accounts payable Salaries payable Total current a s Noncurrenties Bonds payable Other Total...
can someone help me with M and N please
thank you
Financial statements for Fanning Company follow FANNING COMPANY Balance Sheets As of December 31 2019 2018 25.000 241,000 208.000 280,000 31,000 $584 000 26.000 $524 000 $ Current assets Cash Marketable securities Accounts receivable net) Inventories Prepaid items Total current assets Investments Plant (net) Land Total assets Liabilities and Stockholders' Equity Liabilities Current liable Notes payable Accounts payable Salaries payable Total current a s Noncurrenties Bonds payable Other Total...
 can someone help me
Financial statements for Fanning Company follow FANNING COMPANY Balance Sheets As of December 31 2019 2018 25.000 241,000 208.000 280,000 31,000 $584 000 26.000 $524 000 $ Current assets Cash Marketable securities Accounts receivable net) Inventories Prepaid items Total current assets Investments Plant (net) Land Total assets Liabilities and Stockholders' Equity Liabilities Current liable Notes payable Accounts payable Salaries payable Total current a s Noncurrenties Bonds payable Other Total noncurrent abilities Total liabilities Stockholders' equity Preferred...
can someone help me
Financial statements for Fanning Company follow FANNING COMPANY Balance Sheets As of December 31 2019 2018 25.000 241,000 208.000 280,000 31,000 $584 000 26.000 $524 000 $ Current assets Cash Marketable securities Accounts receivable net) Inventories Prepaid items Total current assets Investments Plant (net) Land Total assets Liabilities and Stockholders' Equity Liabilities Current liable Notes payable Accounts payable Salaries payable Total current a s Noncurrenties Bonds payable Other Total noncurrent abilities Total liabilities Stockholders' equity Preferred...
 can someone help me with
G H I and O please
Financial statements for Fanning Company follow FANNING COMPANY Balance Sheets As of December 31 2019 2018 25.000 241,000 208.000 280,000 31,000 $584 000 26.000 $524 000 $ Current assets Cash Marketable securities Accounts receivable net) Inventories Prepaid items Total current assets Investments Plant (net) Land Total assets Liabilities and Stockholders' Equity Liabilities Current liable Notes payable Accounts payable Salaries payable Total current a s Noncurrenties Bonds payable Other Total...
can someone help me with
G H I and O please
Financial statements for Fanning Company follow FANNING COMPANY Balance Sheets As of December 31 2019 2018 25.000 241,000 208.000 280,000 31,000 $584 000 26.000 $524 000 $ Current assets Cash Marketable securities Accounts receivable net) Inventories Prepaid items Total current assets Investments Plant (net) Land Total assets Liabilities and Stockholders' Equity Liabilities Current liable Notes payable Accounts payable Salaries payable Total current a s Noncurrenties Bonds payable Other Total...
 Problem 13-4A Calculation of financial statement ratios LO P3 Selected year-end financial statements of Cabot Corporation follow. (All sales were on credit; selected balance sheet amounts at December 31, 2016, were inventory, $49,900; total assets, $179,400; common stock, $85,000; and retained earnings, $37,004.) CABOT CORPORATION Income Statement For Year Ended December 31, 2017 $451,600 297,850 153,750 98,800 4,300 50,650 20,404 Sales Cost of goods sold Gross profit Operating expenses Interest expense Income before taxes Income taxes $ 30,246 Net income...
 QUESTION 3 From following financial statements, calculate following ratios and analyse the current year and previous year performance a) Current ratio. b) Days sales outstanding (DSO). (Sales 2017 RM500m & Sales 2018 RM600m) c) Inventory turnover ratio d) Total debt to assets e) Return on assets (ROA) (Net income 2017 RM42m &Net income 2018 RM58m) Moon Inc. Balance Sheet (RM millions) as at December 31, 2015 and 2016 2015 21 51 2016 20 84 Cash Accounts receivable Inventory Prepaid expenses...
Most questions answered within 3 hours.
-
Calculate Ecell for the following reaction and conditions: 0.50
M Br2 (aq), 0.10 M Pb+2 (aq),...
asked 1 minute ago -
There can be more than one correct answer.
Hypophysiotropic hormones:
A. released by the hypothalamus
B....
asked 7 minutes ago -
Scott Ruskin is the CEO of Decatur Materials. The company has
been struggling for the last...
asked 5 minutes ago -
If you were conducting a study involving twins regarding
genetics and/or upbringing, which would you use?...
asked 27 minutes ago -
Part 1- Inventory: You own a toy company and
you are producing wooden rocking horses. Assume...
asked 35 minutes ago -
What is aromaticity?
Identify aromatic molecules, especially those containing O, N,
S and B
asked 38 minutes ago -
A rubber solid circular wheel of uniform density spins about it
axis at rate of 60...
asked 50 minutes ago -
DNA evidence from an early human skeleton in Britain, shows that
early inhabitants of were blue...
asked 41 minutes ago -
Financial data for Joel de Paris, Inc., for last year
follow:
Joel de Paris, Inc.
Balance...
asked 50 minutes ago -
To practice Problem-Solving Strategy 19.1 Work in Ideal-gas
Processes.
A cylinder with initial volume V contains...
asked 58 minutes ago -
Depreciation for Partial Periods Bean Delivery Company purchased
a new delivery truck for $35,400 on April...
asked 1 hour ago -
Q 5.23:
Jonathan has been doing calculations to determine a missing
component. So far he has...
asked 1 hour ago