Selected comparative financial statements of Korbin Company follow.
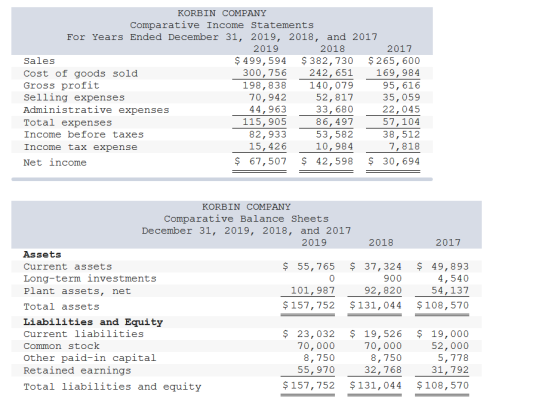
3. Complete the below table to calculate the balance sheet data in trend percents with 2017 as base year. (Round your percentage answers to 2 decimal places.)

Homework Answers
Solution
| KORBIN COMPANY | |||
| Balance sheet Data in trend percents | |||
| December 31, 2017, 2016 and 2016 | |||
| 2019 | 2018 | 2017 | |
| Assets | |||
| Current assets | 111.77% | 74.81% | 100.00% |
| Long-term investment | 0.00% | 19.82% | 100.00% |
| Plant asset, net | 188.39% | 171.45% | 100.00% |
| Total assets | 145.30% | 120.70% | 100.00% |
| Liabilities and equity | |||
| Current liabilities | 121.22% | 102.77% | 100.00% |
| Common stock | 134.62% | 134.62% | 100.00% |
| other paid in capital | 151.44% | 151.44% | 100.00% |
| Retained earnings | 176.05% | 103.07% | 100.00% |
| Total liabilities and equity | 145.30% | 120.70% | 100.00% |
Add Answer to:
Selected comparative financial statements of Korbin Company
follow.
3. Complete the below table to calculate the...
Selected comparative financial statements of Korbin Company follow. KORBIN COMPANY Comparative Income Statements For Years Ended...
 Selected comparative financial statements of Korbin Company follow. KORBIN COMPANY Comparative Income Statements For Years Ended December 31, 2019, 2018, and. 2017 2019 2018 2017 $434,323 $332,727 $230,900 Sales Cost of goods sold 261,462 Gross profit Selling expenses Administrative 209,951 122,776 147,776 83,124 172,861 61,674 45,916 30,479 39,089 29,280 19,165 expenses Total expenses Income before 100,763 75,196 49,644 72,098 47,580 33,480 taxes Income tax expense 13,410 9,754 6,796 $58,688 $ 37,826 26,684 Net income KORBIN COMPANY Comparative Balance Sheets December...
Selected comparative financial statements of Korbin Company follow. KORBIN COMPANY Comparative Income Statements For Years Ended...
 Selected comparative financial statements of Korbin Company follow. KORBIN COMPANY Comparative Income Statements For Years Ended December 31, 2019, 2018, and 2017 2019 2018 2017 Sales $ 524,799 $ 402,039 $ 279,000 Cost of goods sold 315,929 251,676 178,560 Gross profit 208,870 150,363 100,440 Selling expenses 74,521 55,481 36,828 Administrative expenses 47,232 35, 379 23,157 Total expenses 121,753 90,860 59,985 Income before taxes 87,117 59,503 40, 455 Income tax expense 16, 204 12,198 8,212 Net income $ 70,913 $ 47,305...
Selected comparative financial statements of Korbin Company follow. KORBIN COMPANY Comparative Income Statements For Years Ended...
 Selected comparative financial statements of Korbin Company follow. KORBIN COMPANY Comparative Income Statements For Years Ended December 31, 2019, 2018, and 2017 2019 2018 2017 Sales $ 471,191 $360, 971 $ 250, 500 Cost of goods sold 283, 657 226, 329 160, 320 Gross profit 187,534 134, 642 90, 180 Selling expenses 66,909 49,814 33,066 Administrative expenses 42, 407 31,765 20,792 Total expenses 109, 316 81,579 53, 858 Income before taxes 78, 218 53,063 36, 322 Income tax expense 14,549...
Selected comparative financial statements of Korbin Company follow. KORBIN COMPANY Comparative Income Statements For Years Ended...
 Selected comparative financial statements of Korbin Company follow. KORBIN COMPANY Comparative Income Statements For Years Ended December 31, 2019, 2018, and 2017 2019 2018 2017 Sales $ 427,928 $ 327,828 $ 227,500 Cost of goods sold 257,613 207,515 145,600 Gross profit 170,315 120,313 81,900 Selling expenses 60,766 45, 240 30,030 Administrative expenses 38,514 28,849 18,883 Total expenses 99, 280 74,089 48,913 Income before taxes 71,035 46,224 32,987 Income tax expense 13,213 9,476 6,696 Net income $ 57,822 $ 36,748 $...
Selected comparative financial statements of Korbin Company follow KORBIN COMPANY Comparative Income Statements For Years Ended...
 Selected comparative financial statements of Korbin Company follow KORBIN COMPANY Comparative Income Statements For Years Ended December 31, 2017, 2016, and 2015 2017 2016 2015 $555,000 $340,000 $278,000 Sales Cost of goods sold Gross profit Selling expenses Administrative expenses Total expenses Income before taxes Income taxes Net income 50,800 22,800 73,600 50,500 15,670 $ 77,132 40,290 34,830 283,500 212,500 153,900 271,500 127,500 124,100 46,920 29,920 76,840 50,660 10,370 102,900 50,668 153,568 117,932 40,800 KORBIN COMPANY Comparative Balance Sheets December 31,...
Selected comparative financial statements of Korbin Company follow. KORBIN COMPANY Comparative Income Statements For Years Ended...
 Selected comparative financial statements of Korbin Company follow. KORBIN COMPANY Comparative Income Statements For Years Ended December 31, 2019, 2018, and 2017 2019 2018 2017 Sales $ 508,246 $ 389, 358 $ 270, 2ee Cost of goods sold 305,964 246,074 172,928 Gross profit 282,282 143,284 97,272 Selling expenses 72,171 53,731 35,666 Administrative expenses 45,742 34,264 22,427 Total expenses 117,913 87,995 58,693 Income before taxes 84,369 55,289 39,179 Income tax expense 15,693 11,334 7,953 Net income $ 68,676 $ 43,955 $...
Selected comparative financial statements of Korbin Company follow. KORBIN COMPANY Comparative Income statements For Years Ended...
 Selected comparative financial statements of Korbin Company follow. KORBIN COMPANY Comparative Income statements For Years Ended December 31, 2017, 2016, and 2015 2017 2016 Sales $ 430,561 $ 329,845 cost of goods sold 259,198 208, 132 Gross profit 171,363 121, 713 selling expenses 61,140 45,519 Administrative expenses 38,750 29, 026 Total expenses 99,890 74,545 Income before taxes 71,473 47,168 Income taxes 13, 294 9,669 Net income 58,179 $ 37,499 2015 $ 228,900 146,496 82,404 30,215 18,999 49,214 33,190 6,738 $...
Selected comparative financial statements of Korbin Company follow: KORBIN COMPANY Comparative Income Statements For Years Ended...
 Selected comparative financial statements of Korbin Company
follow:
KORBIN COMPANY
Comparative Income Statements
For Years Ended December 31, 2017, 2016, and
2015
2017
2016
2015
Sales
$
554,143
$
424,519
$
294,600
Cost of goods sold
333,594
269,145
188,544
Gross profit
220,549
155,374
106,056
Selling expenses
78,688
58,584
38,887
Administrative expenses
49,873
37,358
24,452
Total expenses
128,561
95,942
63,339
Income before taxes
91,988
59,432
42,717
Income taxes
17,110
12,184
8,672
Net income
$
74,878
$
47,248
$
34,045
KORBIN COMPANY...
Selected comparative financial statements of Korbin Company
follow:
KORBIN COMPANY
Comparative Income Statements
For Years Ended December 31, 2017, 2016, and
2015
2017
2016
2015
Sales
$
554,143
$
424,519
$
294,600
Cost of goods sold
333,594
269,145
188,544
Gross profit
220,549
155,374
106,056
Selling expenses
78,688
58,584
38,887
Administrative expenses
49,873
37,358
24,452
Total expenses
128,561
95,942
63,339
Income before taxes
91,988
59,432
42,717
Income taxes
17,110
12,184
8,672
Net income
$
74,878
$
47,248
$
34,045
KORBIN COMPANY...
Selected comparative financial statements of Korbin Company follow. KORBIN COMPANY Comparative Income Statements For Years Ended...
 Selected comparative financial statements of Korbin Company follow. KORBIN COMPANY Comparative Income Statements For Years Ended December 31, 2019, 2018, and 2017 2019 2018 2017 Sales $ 386,922 $296,414 $ 205,700 Cost of goods sold 232,927 185,259 131,648 Gross profit 153,995 111,155 74,052 Selling expenses 54,943 40,905 27,152 Administrative expenses 34,823 26,084 17,073 Total expenses 89,766 66,989 44, 225 Income before taxes 64,129 44,166 29,827 Income tax expense 11,947 9,054 6,055 Net income $ 52,282 $ 35,112 $ 23,772 2017...
Selected comparative financial statements of Korbin Company follow. KORBIN COMPANY Comparative Income Statements For Years Ended...
 Selected comparative financial statements of Korbin Company follow. KORBIN COMPANY Comparative Income Statements For Years Ended December 31, 2019, 2018, and 2017 2019 2018 2017 Sales $ 471,191 $360, 971 $ 250, 500 Cost of goods sold 283, 657 226, 329 160, 320 Gross profit 187,534 134, 642 90, 180 Selling expenses 66,909 49,814 33,066 Administrative expenses 42, 407 31,765 20,792 Total expenses 109, 316 81,579 53, 858 Income before taxes 78, 218 53,063 36, 322 Income tax expense 14,549...
 Selected comparative financial statements of Korbin Company follow. KORBIN COMPANY Comparative Income Statements For Years Ended December 31, 2019, 2018, and. 2017 2019 2018 2017 $434,323 $332,727 $230,900 Sales Cost of goods sold 261,462 Gross profit Selling expenses Administrative 209,951 122,776 147,776 83,124 172,861 61,674 45,916 30,479 39,089 29,280 19,165 expenses Total expenses Income before 100,763 75,196 49,644 72,098 47,580 33,480 taxes Income tax expense 13,410 9,754 6,796 $58,688 $ 37,826 26,684 Net income KORBIN COMPANY Comparative Balance Sheets December...
 Selected comparative financial statements of Korbin Company follow. KORBIN COMPANY Comparative Income Statements For Years Ended December 31, 2019, 2018, and 2017 2019 2018 2017 Sales $ 524,799 $ 402,039 $ 279,000 Cost of goods sold 315,929 251,676 178,560 Gross profit 208,870 150,363 100,440 Selling expenses 74,521 55,481 36,828 Administrative expenses 47,232 35, 379 23,157 Total expenses 121,753 90,860 59,985 Income before taxes 87,117 59,503 40, 455 Income tax expense 16, 204 12,198 8,212 Net income $ 70,913 $ 47,305...
 Selected comparative financial statements of Korbin Company follow. KORBIN COMPANY Comparative Income Statements For Years Ended December 31, 2019, 2018, and 2017 2019 2018 2017 Sales $ 471,191 $360, 971 $ 250, 500 Cost of goods sold 283, 657 226, 329 160, 320 Gross profit 187,534 134, 642 90, 180 Selling expenses 66,909 49,814 33,066 Administrative expenses 42, 407 31,765 20,792 Total expenses 109, 316 81,579 53, 858 Income before taxes 78, 218 53,063 36, 322 Income tax expense 14,549...
 Selected comparative financial statements of Korbin Company follow. KORBIN COMPANY Comparative Income Statements For Years Ended December 31, 2019, 2018, and 2017 2019 2018 2017 Sales $ 427,928 $ 327,828 $ 227,500 Cost of goods sold 257,613 207,515 145,600 Gross profit 170,315 120,313 81,900 Selling expenses 60,766 45, 240 30,030 Administrative expenses 38,514 28,849 18,883 Total expenses 99, 280 74,089 48,913 Income before taxes 71,035 46,224 32,987 Income tax expense 13,213 9,476 6,696 Net income $ 57,822 $ 36,748 $...
 Selected comparative financial statements of Korbin Company follow KORBIN COMPANY Comparative Income Statements For Years Ended December 31, 2017, 2016, and 2015 2017 2016 2015 $555,000 $340,000 $278,000 Sales Cost of goods sold Gross profit Selling expenses Administrative expenses Total expenses Income before taxes Income taxes Net income 50,800 22,800 73,600 50,500 15,670 $ 77,132 40,290 34,830 283,500 212,500 153,900 271,500 127,500 124,100 46,920 29,920 76,840 50,660 10,370 102,900 50,668 153,568 117,932 40,800 KORBIN COMPANY Comparative Balance Sheets December 31,...
 Selected comparative financial statements of Korbin Company follow. KORBIN COMPANY Comparative Income Statements For Years Ended December 31, 2019, 2018, and 2017 2019 2018 2017 Sales $ 508,246 $ 389, 358 $ 270, 2ee Cost of goods sold 305,964 246,074 172,928 Gross profit 282,282 143,284 97,272 Selling expenses 72,171 53,731 35,666 Administrative expenses 45,742 34,264 22,427 Total expenses 117,913 87,995 58,693 Income before taxes 84,369 55,289 39,179 Income tax expense 15,693 11,334 7,953 Net income $ 68,676 $ 43,955 $...
 Selected comparative financial statements of Korbin Company follow. KORBIN COMPANY Comparative Income statements For Years Ended December 31, 2017, 2016, and 2015 2017 2016 Sales $ 430,561 $ 329,845 cost of goods sold 259,198 208, 132 Gross profit 171,363 121, 713 selling expenses 61,140 45,519 Administrative expenses 38,750 29, 026 Total expenses 99,890 74,545 Income before taxes 71,473 47,168 Income taxes 13, 294 9,669 Net income 58,179 $ 37,499 2015 $ 228,900 146,496 82,404 30,215 18,999 49,214 33,190 6,738 $...
 Selected comparative financial statements of Korbin Company
follow:
KORBIN COMPANY
Comparative Income Statements
For Years Ended December 31, 2017, 2016, and
2015
2017
2016
2015
Sales
$
554,143
$
424,519
$
294,600
Cost of goods sold
333,594
269,145
188,544
Gross profit
220,549
155,374
106,056
Selling expenses
78,688
58,584
38,887
Administrative expenses
49,873
37,358
24,452
Total expenses
128,561
95,942
63,339
Income before taxes
91,988
59,432
42,717
Income taxes
17,110
12,184
8,672
Net income
$
74,878
$
47,248
$
34,045
KORBIN COMPANY...
Selected comparative financial statements of Korbin Company
follow:
KORBIN COMPANY
Comparative Income Statements
For Years Ended December 31, 2017, 2016, and
2015
2017
2016
2015
Sales
$
554,143
$
424,519
$
294,600
Cost of goods sold
333,594
269,145
188,544
Gross profit
220,549
155,374
106,056
Selling expenses
78,688
58,584
38,887
Administrative expenses
49,873
37,358
24,452
Total expenses
128,561
95,942
63,339
Income before taxes
91,988
59,432
42,717
Income taxes
17,110
12,184
8,672
Net income
$
74,878
$
47,248
$
34,045
KORBIN COMPANY...
 Selected comparative financial statements of Korbin Company follow. KORBIN COMPANY Comparative Income Statements For Years Ended December 31, 2019, 2018, and 2017 2019 2018 2017 Sales $ 386,922 $296,414 $ 205,700 Cost of goods sold 232,927 185,259 131,648 Gross profit 153,995 111,155 74,052 Selling expenses 54,943 40,905 27,152 Administrative expenses 34,823 26,084 17,073 Total expenses 89,766 66,989 44, 225 Income before taxes 64,129 44,166 29,827 Income tax expense 11,947 9,054 6,055 Net income $ 52,282 $ 35,112 $ 23,772 2017...
 Selected comparative financial statements of Korbin Company follow. KORBIN COMPANY Comparative Income Statements For Years Ended December 31, 2019, 2018, and 2017 2019 2018 2017 Sales $ 471,191 $360, 971 $ 250, 500 Cost of goods sold 283, 657 226, 329 160, 320 Gross profit 187,534 134, 642 90, 180 Selling expenses 66,909 49,814 33,066 Administrative expenses 42, 407 31,765 20,792 Total expenses 109, 316 81,579 53, 858 Income before taxes 78, 218 53,063 36, 322 Income tax expense 14,549...
Most questions answered within 3 hours.
-
Coding in C. Please only use stdio.h (which would mean no malloc
or anything like that)...
asked 7 seconds ago -
A sample of n = 25 scores produces a t statistic of t =
-2.062. If...
asked 1 minute ago -
A population has a mean of 200 and a standard deviation of 60.
Suppose a sample...
asked 2 minutes ago -
A bicyclist starting at rest produces a constant angular
acceleration of 1.10 rad/s2 for wheels that...
asked 16 minutes ago -
The
half-life of a radioactive source is 14.0 minutes. How much time
must elapse before the...
asked 14 minutes ago -
Given P(Ec ) = 0.43, P(F) = 0.52, and P(EF) = 0.18.
Find P( E |...
asked 1 hour ago -
Consider two empty containers A and B whose volumes are
10mL and 20mL respectively. 1mL of...
asked 1 hour ago -
QUESTION 6
Determine the linear momentum of a 2,800 kg houseboat going 3
m/s.
9,100 kg.m/s...
asked 1 hour ago -
Jor-el throws a ball upward from the top of a 728 foot building
on the planet...
asked 1 hour ago -
Which of the following will most likely to happen if Federal
Reserve Bank decreases the money...
asked 1 hour ago -
You’ve just joined the investment banking firm of Dewey,
Cheatum, and Howe. They’ve offered you two...
asked 59 minutes ago -
An air conditioner cools 226 m^3/min of humid air at 36 oC and
98% relative humidity...
asked 58 minutes ago