Hi, I have answers some of the questions,, I just have trouble with number 3, 6 and 7 and this is about making a graph.. For this graph we are just using a simple graphing paper and if you could teach me how to graph these points and following the requirements in the questions. thank you!
Homework Answers

Add Answer to:
Hi, I have answers some of the questions,, I just have trouble
with number 3, 6...
Do question 3 pls... I need the answer on how to do this graph properly Water...
 Do question 3 pls... I need the answer on how to do this graph
properly
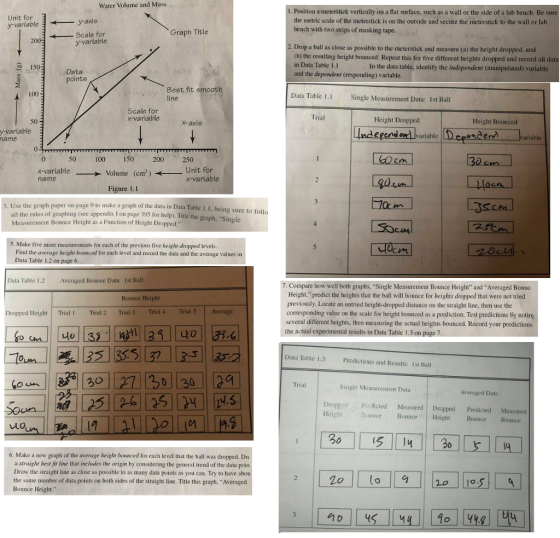
Water Volume and Mass 1. Position a meterstick vertically on a flat surface, such as a wall or the side of a lab bench. Be su Unit for y-variable-y-axis the metric scale of the meterstick is on the outside and secure the meterstick to the wall or lab bench with two strips of masking tape. Graph Title 200Scale for y-variable 2. Drop a ball as...
Do question 3 pls... I need the answer on how to do this graph
properly
Water Volume and Mass 1. Position a meterstick vertically on a flat surface, such as a wall or the side of a lab bench. Be su Unit for y-variable-y-axis the metric scale of the meterstick is on the outside and secure the meterstick to the wall or lab bench with two strips of masking tape. Graph Title 200Scale for y-variable 2. Drop a ball as...
answer question 6 pls Water Volume and Mass 1. Position a meterstick vertically on a flat...
 answer question 6 pls
Water Volume and Mass 1. Position a meterstick vertically on a flat surface, such as a wall or the side of a lab bench. Be sure Unit for y-variable- y-axis the metric scale of the meterstick is on the outside and secure the meterstick to the wall or lab bench with two strips of masking tape. 200Scale for y-variable Graph Title 2. Drop a ball as close as possible to the meterstick and measure (a) the...
answer question 6 pls
Water Volume and Mass 1. Position a meterstick vertically on a flat surface, such as a wall or the side of a lab bench. Be sure Unit for y-variable- y-axis the metric scale of the meterstick is on the outside and secure the meterstick to the wall or lab bench with two strips of masking tape. 200Scale for y-variable Graph Title 2. Drop a ball as close as possible to the meterstick and measure (a) the...
*JUST NEED 3 and 4 ANSWERED THANKS* 1. Explore the data: create a scatterplot . 1a....
 *JUST NEED 3 and 4 ANSWERED THANKS*
1. Explore the data: create a scatterplot
. 1a. Type the data into a blank SPSS spreadsheet. Name
variables as Distance and Snowfall respectively. Go to
Graphs-Legacy Dialogs-Scatter/Dot-Simple Scatter-Define. In the
window that follows, select Distance into X axis and Snowfall into
Y axis. Click on OK.
1b.Double click on the scatter plot to activate it. Double click
on the horizontal axis and select the Scale tab. At Auto, uncheck
all boxes. At...
*JUST NEED 3 and 4 ANSWERED THANKS*
1. Explore the data: create a scatterplot
. 1a. Type the data into a blank SPSS spreadsheet. Name
variables as Distance and Snowfall respectively. Go to
Graphs-Legacy Dialogs-Scatter/Dot-Simple Scatter-Define. In the
window that follows, select Distance into X axis and Snowfall into
Y axis. Click on OK.
1b.Double click on the scatter plot to activate it. Double click
on the horizontal axis and select the Scale tab. At Auto, uncheck
all boxes. At...
I have questions 1-5. I just need help with number 6. Thank you! Assume that the...
 I have questions 1-5. I just need help with number 6. Thank
you!
Assume that the concentration of the glucose standard sample is 1.200 mg/ml. Use the following results to perform your calculations: 1. Calculate the concentration of glucose in tubes 1 through 5 (in mu g/ml). 2. Make graphs of A_ vs. concentration and A_ vs. amount (in mu g). It is suggested that you use the program module Excel in Microsoft Office. Instructions are provided in Statistical Calculations...
I have questions 1-5. I just need help with number 6. Thank
you!
Assume that the concentration of the glucose standard sample is 1.200 mg/ml. Use the following results to perform your calculations: 1. Calculate the concentration of glucose in tubes 1 through 5 (in mu g/ml). 2. Make graphs of A_ vs. concentration and A_ vs. amount (in mu g). It is suggested that you use the program module Excel in Microsoft Office. Instructions are provided in Statistical Calculations...
DATA TABLE Number of books Height of books, h (m) Length of incline, x (m) Acceleration...
 DATA TABLE Number of books Height of books, h (m) Length of incline, x (m) Acceleration Trial 1 Trial 2 Trial 3 (m/s) (m/s) (m/s) Average acceleration (m/s) sin(0) 3 4 5 10,005 m 0.092 0.0082m 0.092 6.ollm 0.092 0.0135m20 0.0154m/0.092 0.05 0.785 0.780 0.775 1.78) 10.08/1.02/1.17 1.08 1.09 11.2 1.41 1.32 1.72 1.48 10.14 1.60 1.681.68 1.65 0.15 1.81 1.77 1.80 1679 ANALYSIS 1. Using trigonometry and your value Bongonometry and your values of x and h in the...
I need help with Questions 3 & 5. I also need help with the data Analysis...
 I need help with Questions 3 & 5. I also need help with
the data Analysis protion with the graph. i have provided the data
sheet with this post. please help!!
Post-Lab Questions 1. What was your hypothesis as to what would happen to the gummy bear? Was it correct? That the gummy bear would expand in Size 2. How long did your gummy bear soak? What do you think would have happened if you left it in the water...
I need help with Questions 3 & 5. I also need help with
the data Analysis protion with the graph. i have provided the data
sheet with this post. please help!!
Post-Lab Questions 1. What was your hypothesis as to what would happen to the gummy bear? Was it correct? That the gummy bear would expand in Size 2. How long did your gummy bear soak? What do you think would have happened if you left it in the water...
Table 6 and Table 7 and Table 8 Calculations Please! oni a auns ayeu oj seg on aup uo syans...
 Table 6 and Table 7 and Table 8 Calculations
Please!
oni a auns ayeu oj seg on aup uo syans sped ojaA al o suousod ap snipe os paau no x between two balls although they look like sticking together, but the timers count them separately aery ut aun1. un ep an i ( Table 1 Data of the balls' mass, dimension and position. m (kg) d (m) d, (m) d, (m) h, (m) 031S 03I Ol05 O01135 O L...
Table 6 and Table 7 and Table 8 Calculations
Please!
oni a auns ayeu oj seg on aup uo syans sped ojaA al o suousod ap snipe os paau no x between two balls although they look like sticking together, but the timers count them separately aery ut aun1. un ep an i ( Table 1 Data of the balls' mass, dimension and position. m (kg) d (m) d, (m) d, (m) h, (m) 031S 03I Ol05 O01135 O L...
 Do question 3 pls... I need the answer on how to do this graph
properly
Water Volume and Mass 1. Position a meterstick vertically on a flat surface, such as a wall or the side of a lab bench. Be su Unit for y-variable-y-axis the metric scale of the meterstick is on the outside and secure the meterstick to the wall or lab bench with two strips of masking tape. Graph Title 200Scale for y-variable 2. Drop a ball as...
Do question 3 pls... I need the answer on how to do this graph
properly
Water Volume and Mass 1. Position a meterstick vertically on a flat surface, such as a wall or the side of a lab bench. Be su Unit for y-variable-y-axis the metric scale of the meterstick is on the outside and secure the meterstick to the wall or lab bench with two strips of masking tape. Graph Title 200Scale for y-variable 2. Drop a ball as...
 answer question 6 pls
Water Volume and Mass 1. Position a meterstick vertically on a flat surface, such as a wall or the side of a lab bench. Be sure Unit for y-variable- y-axis the metric scale of the meterstick is on the outside and secure the meterstick to the wall or lab bench with two strips of masking tape. 200Scale for y-variable Graph Title 2. Drop a ball as close as possible to the meterstick and measure (a) the...
answer question 6 pls
Water Volume and Mass 1. Position a meterstick vertically on a flat surface, such as a wall or the side of a lab bench. Be sure Unit for y-variable- y-axis the metric scale of the meterstick is on the outside and secure the meterstick to the wall or lab bench with two strips of masking tape. 200Scale for y-variable Graph Title 2. Drop a ball as close as possible to the meterstick and measure (a) the...
 *JUST NEED 3 and 4 ANSWERED THANKS*
1. Explore the data: create a scatterplot
. 1a. Type the data into a blank SPSS spreadsheet. Name
variables as Distance and Snowfall respectively. Go to
Graphs-Legacy Dialogs-Scatter/Dot-Simple Scatter-Define. In the
window that follows, select Distance into X axis and Snowfall into
Y axis. Click on OK.
1b.Double click on the scatter plot to activate it. Double click
on the horizontal axis and select the Scale tab. At Auto, uncheck
all boxes. At...
*JUST NEED 3 and 4 ANSWERED THANKS*
1. Explore the data: create a scatterplot
. 1a. Type the data into a blank SPSS spreadsheet. Name
variables as Distance and Snowfall respectively. Go to
Graphs-Legacy Dialogs-Scatter/Dot-Simple Scatter-Define. In the
window that follows, select Distance into X axis and Snowfall into
Y axis. Click on OK.
1b.Double click on the scatter plot to activate it. Double click
on the horizontal axis and select the Scale tab. At Auto, uncheck
all boxes. At...
 I have questions 1-5. I just need help with number 6. Thank
you!
Assume that the concentration of the glucose standard sample is 1.200 mg/ml. Use the following results to perform your calculations: 1. Calculate the concentration of glucose in tubes 1 through 5 (in mu g/ml). 2. Make graphs of A_ vs. concentration and A_ vs. amount (in mu g). It is suggested that you use the program module Excel in Microsoft Office. Instructions are provided in Statistical Calculations...
I have questions 1-5. I just need help with number 6. Thank
you!
Assume that the concentration of the glucose standard sample is 1.200 mg/ml. Use the following results to perform your calculations: 1. Calculate the concentration of glucose in tubes 1 through 5 (in mu g/ml). 2. Make graphs of A_ vs. concentration and A_ vs. amount (in mu g). It is suggested that you use the program module Excel in Microsoft Office. Instructions are provided in Statistical Calculations...
 DATA TABLE Number of books Height of books, h (m) Length of incline, x (m) Acceleration Trial 1 Trial 2 Trial 3 (m/s) (m/s) (m/s) Average acceleration (m/s) sin(0) 3 4 5 10,005 m 0.092 0.0082m 0.092 6.ollm 0.092 0.0135m20 0.0154m/0.092 0.05 0.785 0.780 0.775 1.78) 10.08/1.02/1.17 1.08 1.09 11.2 1.41 1.32 1.72 1.48 10.14 1.60 1.681.68 1.65 0.15 1.81 1.77 1.80 1679 ANALYSIS 1. Using trigonometry and your value Bongonometry and your values of x and h in the...
 I need help with Questions 3 & 5. I also need help with
the data Analysis protion with the graph. i have provided the data
sheet with this post. please help!!
Post-Lab Questions 1. What was your hypothesis as to what would happen to the gummy bear? Was it correct? That the gummy bear would expand in Size 2. How long did your gummy bear soak? What do you think would have happened if you left it in the water...
I need help with Questions 3 & 5. I also need help with
the data Analysis protion with the graph. i have provided the data
sheet with this post. please help!!
Post-Lab Questions 1. What was your hypothesis as to what would happen to the gummy bear? Was it correct? That the gummy bear would expand in Size 2. How long did your gummy bear soak? What do you think would have happened if you left it in the water...
 Table 6 and Table 7 and Table 8 Calculations
Please!
oni a auns ayeu oj seg on aup uo syans sped ojaA al o suousod ap snipe os paau no x between two balls although they look like sticking together, but the timers count them separately aery ut aun1. un ep an i ( Table 1 Data of the balls' mass, dimension and position. m (kg) d (m) d, (m) d, (m) h, (m) 031S 03I Ol05 O01135 O L...
Table 6 and Table 7 and Table 8 Calculations
Please!
oni a auns ayeu oj seg on aup uo syans sped ojaA al o suousod ap snipe os paau no x between two balls although they look like sticking together, but the timers count them separately aery ut aun1. un ep an i ( Table 1 Data of the balls' mass, dimension and position. m (kg) d (m) d, (m) d, (m) h, (m) 031S 03I Ol05 O01135 O L...
Most questions answered within 3 hours.
-
Write a program to solve the Josephus problem, with the following
modification:
Sample Input:
./a.out n...
asked 1 hour ago -
At the start of a CD it is spinning at a rate of 525 rpm
(revolutions...
asked 2 hours ago -
4. Without doing any calculations, predict whether the observed
∆T would increase, decrease or remain the...
asked 3 hours ago -
Based on the range, which of the following sets of scores has
the greatest variability? 3,...
asked 4 hours ago -
Ripples in a pond travel at a velocity of 3 m/s with one peak
passing a...
asked 4 hours ago -
A man stands on the roof of a building of height 13.0 mm and
throws a...
asked 4 hours ago -
The extent to which assets are financed by borrowed funds and
other liabilities is indicated by:...
asked 5 hours ago -
Explain in detail
Germany is the fifth largest economy
explain what goods and services Germany specializes...
asked 5 hours ago -
The density of platinum is 21.45 g/mL. If a cube of platinum
with a mass of...
asked 5 hours ago -
Accounts Receivable
Sales
A/R Posting
Extended Sales Invoice
Packing Slip
Compare invoice to packing slip 2...
asked 5 hours ago -
Michaella, age 23, is a full-time law student and is claimed by
her parents as a...
asked 5 hours ago -
Why are polymers not typically casted into products?
asked 6 hours ago