
Homework Answers
Add Answer to:
Problem #4: Own-price elasticity Suppose the market labor demand curve is given by LD 20- (1/2)W...
Problem #4: Own-price elasticity Suppose the market labor demand curve is given by LD-20-(1/2)W and the...
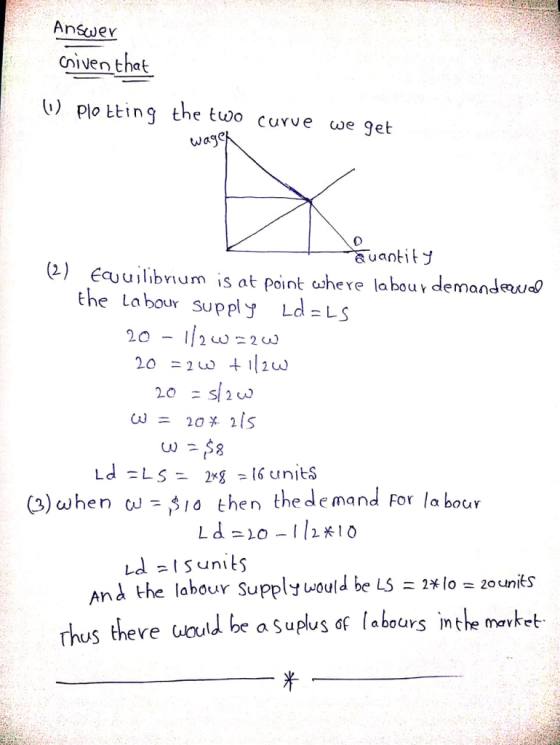
 Problem #4: Own-price elasticity Suppose the market labor demand curve is given by LD-20-(1/2)W and the market labor supply curve is given by LS-2 1. Graph the labor demand curve and the labor supply curve on the same graph (with L on the horizontal axis and W on the vertical axis, as we have done in class) 2 Determine the equilibrium employment (L') and wage (W) in this market 3. Now suppose the government implements a minimum wage (WM) of...
Problem #4: Own-price elasticity Suppose the market labor demand curve is given by LD = 20-(1/2,W...
 Problem #4: Own-price elasticity Suppose the market labor demand curve is given by LD = 20-(1/2,W and the market labor supply curve is given by LS 2 1. Graph the labor demand curve and the labor supply curve on the same graph (with L on the horizontal axis and W on the vertical axis, as we have done in class) 2. Determine the equilibrium employment (L and wage (W in this market 3. Now suppose the government implements a minimum...
9. Suppose that a monopsony faces a labor supply curve of Ls-2+2w. What wage does the...
 9. Suppose that a monopsony faces a labor supply curve of Ls-2+2w. What wage does the firm paw if it wants to hire 10 workers? b. What is the marginal expense of hiring an 10 worker? c. Draw a sample (or the exact) Labor Supply curve. Now add in a sample, ME curve and MRP curve such that the equilibrium is at 10 workers and at the wage from part a. Label the equilibrium level of employment and the equilibrium...
5. Suppose the supply curve of physicists is given by w = 10 +5E, while the...
 5. Suppose the supply curve of physicists is given by w = 10 +5E, while the demand curve is given by w= 50 - 3E. a) Calculate the equilibrium wage and employment level. Calculate the labour demand elasticity at the equilibrium. Suppose now that the demand for physicists increases to w= 70 - 3E. What is the new equilibrium wage and employment level? b) Assume the market is subject to cobwebs. Draw a graph to illustrate the wage and employment...
Suppose in a particular labor market, the demand for labor is given by the equation LD...
Suppose in a particular labor market, the demand for labor is given by the equation LD = 120 – 3W and that the labor supply in this market for native-born citizens is given by LN = 3W, while the supply curve of immigrants in this market is given by LI = 2W, where L represents the number of workers, W is the wage expressed in real terms.
Consider the following labor market Labor demand: LD = ap - w Labor supply: LS =...
 Consider the following labor market Labor demand: LD = ap - w Labor supply: LS = as + 2w where w is the wage, L is the number of workers, ap and as are constants Now suppose that business owners predict low sales next year so they reduce hiring and as a result, ap=70,000 and ag=10,000. But in this scenario wages are totally rigid and cannot adjust this year from its original level (i.e. when ap=100,000 and ag=10,000): find the...
6. Suppose that the supply curve for school teachers is Ls - 20,000 + 350W and...
 6. Suppose that the supply curve for school teachers is Ls - 20,000 + 350W and the demand curve for school teachers is Ld = 100,000 - 150W, where L = the number of teachers and W= the daily wage. a. Plot the demand and supply curves. b. What are the equilibrium wage and employment level in this market? c. Now suppose that at any given wage 20,000 more workers are willing to work as school teachers. Plot the new...
2. Now, go back to the original supply and demand equations: Ed 60 2*w Es =-10+5"w...
 2. Now, go back to the original supply and demand equations: Ed 60 2*w Es =-10+5"w Redraw these on a new graph, as you did in the above question Suppose that a minimum wage of S12/hr is now imposed. a) What is the quantity demanded at this new wage? What is the quantity supplied? How many workers are hired? How many jobs are lost? b) Show all of the above on your graph. Once again, with the minimum wage in...
The market for waiters is defined by the following demand and supply curves: w = 20...
The market for waiters is defined by the following demand and supply curves: w = 20 − 0.2ED (Demand) w = 13 + 0.1ES (Supply) a) Graph the demand and supply curves. Make sure the wage w is on the y-axis and employment E is on the x-axis. On the graph, indicate where the equilibrium wage and employment level would be by denoting them w∗ and E∗, respectively. b) Solve for equilibrium wage and employment. Now, suppose the industry buys...
What is the equilibrium employment level? Question 2 Consider the following labor market Labor demand: L...
 What is the equilibrium employment level?
Question 2 Consider the following labor market Labor demand: L ap- w Labor supply: LS = as 2w where w is the wage, Lis the number of workers, ap and as are constants a) Suppose that ap 100,000 and as10,000: find the equilibrium employment level L*30,000 L*35,000 L60,000 L70,000
What is the equilibrium employment level?
Question 2 Consider the following labor market Labor demand: L ap- w Labor supply: LS = as 2w where w is the wage, Lis the number of workers, ap and as are constants a) Suppose that ap 100,000 and as10,000: find the equilibrium employment level L*30,000 L*35,000 L60,000 L70,000
 Problem #4: Own-price elasticity Suppose the market labor demand curve is given by LD-20-(1/2)W and the market labor supply curve is given by LS-2 1. Graph the labor demand curve and the labor supply curve on the same graph (with L on the horizontal axis and W on the vertical axis, as we have done in class) 2 Determine the equilibrium employment (L') and wage (W) in this market 3. Now suppose the government implements a minimum wage (WM) of...
 Problem #4: Own-price elasticity Suppose the market labor demand curve is given by LD = 20-(1/2,W and the market labor supply curve is given by LS 2 1. Graph the labor demand curve and the labor supply curve on the same graph (with L on the horizontal axis and W on the vertical axis, as we have done in class) 2. Determine the equilibrium employment (L and wage (W in this market 3. Now suppose the government implements a minimum...
 9. Suppose that a monopsony faces a labor supply curve of Ls-2+2w. What wage does the firm paw if it wants to hire 10 workers? b. What is the marginal expense of hiring an 10 worker? c. Draw a sample (or the exact) Labor Supply curve. Now add in a sample, ME curve and MRP curve such that the equilibrium is at 10 workers and at the wage from part a. Label the equilibrium level of employment and the equilibrium...
 5. Suppose the supply curve of physicists is given by w = 10 +5E, while the demand curve is given by w= 50 - 3E. a) Calculate the equilibrium wage and employment level. Calculate the labour demand elasticity at the equilibrium. Suppose now that the demand for physicists increases to w= 70 - 3E. What is the new equilibrium wage and employment level? b) Assume the market is subject to cobwebs. Draw a graph to illustrate the wage and employment...
 Consider the following labor market Labor demand: LD = ap - w Labor supply: LS = as + 2w where w is the wage, L is the number of workers, ap and as are constants Now suppose that business owners predict low sales next year so they reduce hiring and as a result, ap=70,000 and ag=10,000. But in this scenario wages are totally rigid and cannot adjust this year from its original level (i.e. when ap=100,000 and ag=10,000): find the...
 6. Suppose that the supply curve for school teachers is Ls - 20,000 + 350W and the demand curve for school teachers is Ld = 100,000 - 150W, where L = the number of teachers and W= the daily wage. a. Plot the demand and supply curves. b. What are the equilibrium wage and employment level in this market? c. Now suppose that at any given wage 20,000 more workers are willing to work as school teachers. Plot the new...
 2. Now, go back to the original supply and demand equations: Ed 60 2*w Es =-10+5"w Redraw these on a new graph, as you did in the above question Suppose that a minimum wage of S12/hr is now imposed. a) What is the quantity demanded at this new wage? What is the quantity supplied? How many workers are hired? How many jobs are lost? b) Show all of the above on your graph. Once again, with the minimum wage in...
 What is the equilibrium employment level?
Question 2 Consider the following labor market Labor demand: L ap- w Labor supply: LS = as 2w where w is the wage, Lis the number of workers, ap and as are constants a) Suppose that ap 100,000 and as10,000: find the equilibrium employment level L*30,000 L*35,000 L60,000 L70,000
What is the equilibrium employment level?
Question 2 Consider the following labor market Labor demand: L ap- w Labor supply: LS = as 2w where w is the wage, Lis the number of workers, ap and as are constants a) Suppose that ap 100,000 and as10,000: find the equilibrium employment level L*30,000 L*35,000 L60,000 L70,000
Most questions answered within 3 hours.
-
A box contains 14 large marbles and 19 small marbles. Each
marble is either green or...
asked 6 minutes ago -
The results of a one-sample t test were t (18) = 2.11,
p < 0.05. In...
asked 16 minutes ago -
What kind of share-based compensation does the company have for
Verizon? What was compensation expense for...
asked 24 minutes ago -
Place each of the following transactions in one of the four
components of expenditure: (remember it...
asked 32 minutes ago -
Find the optimal binary symbol code using the Huffman coding
algorithm. Draw the Huffman tree (show...
asked 35 minutes ago -
Using Rhodes Corporation’s financial statements (shown after
part f), answer the following questions.
a. What is...
asked 34 minutes ago -
Viewers of the ABC news segment may use ___________ to make
generalization about what the individual...
asked 44 minutes ago -
Which of the following captures Locke’s response to Hobbes on
the issue of the enforcement of...
asked 51 minutes ago -
another 515 students are selected at random from florida. they are
given a 3-hour preparation course...
asked 1 hour ago -
A regional distributor deals with a product ABC that has an
annual demand of 3000 unit....
asked 2 hours ago -
You have a 825.3 mL sample of 2.754 M HA (Ka =
4.49⋅10−4). Calculate the pH...
asked 5 hours ago -
The blues made its way into many kinds of music. Eric Clapton,
The Beatles, and Elvis...
asked 7 hours ago