 I need 2 to 6
Homework Answers
Solution2:
random sampling that is selecting subjects that all members of a population have an equal and independent chance of being selected.
random samples tend to be representative of the population,so we can draw better conclusions about it
Solution3:
mean is sensitive to more extreme values called as outliers.median is not affected by extreme values.
median is the best measure as it is not affected by outliers.
Solution4:
histogram is best for continuous numerical variable.
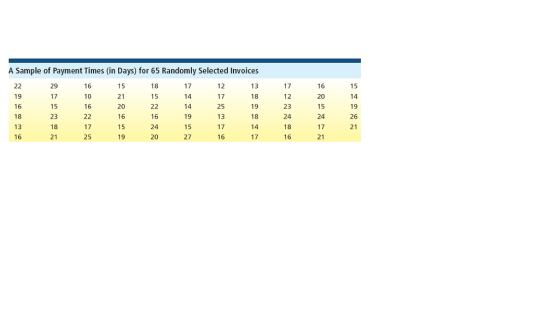
ex :payment times

Solution5:
boxplot is best for continuous numerical variable.
we get five number summary from boxplot
Solution6:
Bar chart: A vertical or horizontal rectangle represents the frequency for each category
Height can be frequency, relative frequency, or percent frequency.

i need nursing care plan for COPD with 2 goal and 6 intevention and 2 evaluation...
i need nursing care plan for COPD with 2 goal and 6 intevention and 2 evaluation all suppose to be evidnace based with rational
I need 3 to 6
 I need 3 to 6
i need structure of nmr nmr structure (c)C6H1402 1743 TTTT 2(6.)+2-14
 i
need structure of nmr
nmr
structure
(c)C6H1402 1743 TTTT 2(6.)+2-14
i
need structure of nmr
nmr
structure
(c)C6H1402 1743 TTTT 2(6.)+2-14
i need someone to help me in the decision making of capsim (6 rounds)(2 segements)?
i need someone to help me in the decision making of capsim (6 rounds)(2 segements)?
I need help modifying this python code: a) I need to take 2 attributes of the...
I need help modifying this python code: a) I need to take 2 attributes of the data as int - (columns (3 & 5) of my data) b) I need to take 2 more attributes as floats -(columns 4&6 of my data) c) I need to take 1 attribute as string (column 16 of my data) How would I modify this code # # Initial version - "standard programming" # # Define a list for the data. The data structure...
help please! i need the mechanism for all steps. i get yo step 6 and i get stuck. thank you! 1) n euli . THE 2) H...
 help please! i need the mechanism for all steps. i get yo step 6
and i get stuck. thank you!
1) n euli . THE 2) H3O+/H2O workup 3) KMnO4, A 4) CH2OH, cat. H2SO4 5) cat. TsOH, 6) 2 equiv. CHgMgBr, THE 7) H2SO4 H2O. A HO
help please! i need the mechanism for all steps. i get yo step 6
and i get stuck. thank you!
1) n euli . THE 2) H3O+/H2O workup 3) KMnO4, A 4) CH2OH, cat. H2SO4 5) cat. TsOH, 6) 2 equiv. CHgMgBr, THE 7) H2SO4 H2O. A HO
I need help with answer number 6. The question is answered but I need to show...
 I need help with answer number 6. The question is answered but I
need to show the formula and I can't seem to get it correct.
Could you please help?
Question 4 41% 41% 4 points Off-The-Books Investment Firm, LLC, has offered you an investment it says will return to you $20,000 in 2 years. To get in, you'll need to make a $10,000 deposit to their receivables account and promise not to tell anyone about it. What is the...
I need help with answer number 6. The question is answered but I
need to show the formula and I can't seem to get it correct.
Could you please help?
Question 4 41% 41% 4 points Off-The-Books Investment Firm, LLC, has offered you an investment it says will return to you $20,000 in 2 years. To get in, you'll need to make a $10,000 deposit to their receivables account and promise not to tell anyone about it. What is the...
i need help with question 6 6. Draw meso compounds and give an example of a...
 i need help with question 6
6. Draw meso compounds and give an example of a cyclic meso compound
i need help with question 6
6. Draw meso compounds and give an example of a cyclic meso compound
solve it ,i need urgent, no need to write neat and clean.. thanks! ......b0nGrr....... 6. Let...
 solve it ,i need urgent, no need to write neat and clean..
thanks!
......b0nGrr.......
6. Let i +22 B(2) 4- 2iz (a) Find the smallest positive real value M such that for every z on the closed unit disk D, B2)<M. [6] (b) A particle on the complex plane is trapped within a wall built along the unit circle. It travels from –i to e3«i/4 and then bouncing from e3wi/4 to 1. Denote by y the curve representing the trajectory...
solve it ,i need urgent, no need to write neat and clean..
thanks!
......b0nGrr.......
6. Let i +22 B(2) 4- 2iz (a) Find the smallest positive real value M such that for every z on the closed unit disk D, B2)<M. [6] (b) A particle on the complex plane is trapped within a wall built along the unit circle. It travels from –i to e3«i/4 and then bouncing from e3wi/4 to 1. Denote by y the curve representing the trajectory...
I need help with number 7 Not the first 2 plots the last 6 7. Consider...
 I need help with number 7
Not the first 2 plots the last 6
7. Consider a linear time invariant (LTI) system that has the impulse response, h(n). where h(0)- h(10) 0.11104155 h(2)-h(8)--0.10321975 (4) (6) 0.317113 h(1)-h(9)-0.00002034 (3)-7) 0.00004237 (5) 0.5001135 and the input x(n) where x 12.35,-3-1,-3,31.-3,-5,-31,3-5,-3-5,5,3-1-3 Calculate the system's output, y(n) i) using the conv function ii) using the fft and ifft and not the conv function Your answers should be identical. Using the figure, subplot, stem, title,...
I need help with number 7
Not the first 2 plots the last 6
7. Consider a linear time invariant (LTI) system that has the impulse response, h(n). where h(0)- h(10) 0.11104155 h(2)-h(8)--0.10321975 (4) (6) 0.317113 h(1)-h(9)-0.00002034 (3)-7) 0.00004237 (5) 0.5001135 and the input x(n) where x 12.35,-3-1,-3,31.-3,-5,-31,3-5,-3-5,5,3-1-3 Calculate the system's output, y(n) i) using the conv function ii) using the fft and ifft and not the conv function Your answers should be identical. Using the figure, subplot, stem, title,...
 I need 3 to 6
 i
need structure of nmr
nmr
structure
(c)C6H1402 1743 TTTT 2(6.)+2-14
i
need structure of nmr
nmr
structure
(c)C6H1402 1743 TTTT 2(6.)+2-14
 help please! i need the mechanism for all steps. i get yo step 6
and i get stuck. thank you!
1) n euli . THE 2) H3O+/H2O workup 3) KMnO4, A 4) CH2OH, cat. H2SO4 5) cat. TsOH, 6) 2 equiv. CHgMgBr, THE 7) H2SO4 H2O. A HO
help please! i need the mechanism for all steps. i get yo step 6
and i get stuck. thank you!
1) n euli . THE 2) H3O+/H2O workup 3) KMnO4, A 4) CH2OH, cat. H2SO4 5) cat. TsOH, 6) 2 equiv. CHgMgBr, THE 7) H2SO4 H2O. A HO
 I need help with answer number 6. The question is answered but I
need to show the formula and I can't seem to get it correct.
Could you please help?
Question 4 41% 41% 4 points Off-The-Books Investment Firm, LLC, has offered you an investment it says will return to you $20,000 in 2 years. To get in, you'll need to make a $10,000 deposit to their receivables account and promise not to tell anyone about it. What is the...
I need help with answer number 6. The question is answered but I
need to show the formula and I can't seem to get it correct.
Could you please help?
Question 4 41% 41% 4 points Off-The-Books Investment Firm, LLC, has offered you an investment it says will return to you $20,000 in 2 years. To get in, you'll need to make a $10,000 deposit to their receivables account and promise not to tell anyone about it. What is the...
 i need help with question 6
6. Draw meso compounds and give an example of a cyclic meso compound
i need help with question 6
6. Draw meso compounds and give an example of a cyclic meso compound
 solve it ,i need urgent, no need to write neat and clean..
thanks!
......b0nGrr.......
6. Let i +22 B(2) 4- 2iz (a) Find the smallest positive real value M such that for every z on the closed unit disk D, B2)<M. [6] (b) A particle on the complex plane is trapped within a wall built along the unit circle. It travels from –i to e3«i/4 and then bouncing from e3wi/4 to 1. Denote by y the curve representing the trajectory...
solve it ,i need urgent, no need to write neat and clean..
thanks!
......b0nGrr.......
6. Let i +22 B(2) 4- 2iz (a) Find the smallest positive real value M such that for every z on the closed unit disk D, B2)<M. [6] (b) A particle on the complex plane is trapped within a wall built along the unit circle. It travels from –i to e3«i/4 and then bouncing from e3wi/4 to 1. Denote by y the curve representing the trajectory...
 I need help with number 7
Not the first 2 plots the last 6
7. Consider a linear time invariant (LTI) system that has the impulse response, h(n). where h(0)- h(10) 0.11104155 h(2)-h(8)--0.10321975 (4) (6) 0.317113 h(1)-h(9)-0.00002034 (3)-7) 0.00004237 (5) 0.5001135 and the input x(n) where x 12.35,-3-1,-3,31.-3,-5,-31,3-5,-3-5,5,3-1-3 Calculate the system's output, y(n) i) using the conv function ii) using the fft and ifft and not the conv function Your answers should be identical. Using the figure, subplot, stem, title,...
I need help with number 7
Not the first 2 plots the last 6
7. Consider a linear time invariant (LTI) system that has the impulse response, h(n). where h(0)- h(10) 0.11104155 h(2)-h(8)--0.10321975 (4) (6) 0.317113 h(1)-h(9)-0.00002034 (3)-7) 0.00004237 (5) 0.5001135 and the input x(n) where x 12.35,-3-1,-3,31.-3,-5,-31,3-5,-3-5,5,3-1-3 Calculate the system's output, y(n) i) using the conv function ii) using the fft and ifft and not the conv function Your answers should be identical. Using the figure, subplot, stem, title,...
Most questions answered within 3 hours.
-
A solid, uniform disk of radius 0.250 m and mass 53.7 kg rolls
down a ramp...
asked 1 hour ago -
Given the following table of high speed internet access vs.
annual home income:
Home Income
%...
asked 1 hour ago -
A baseball batter hits a 0.145kg baseball straight up into the
air. The baseball leaves the...
asked 2 hours ago -
An FM modulator is tested using
single-tone baseband signal with frequency of 50kHz and a sprectrum...
asked 2 hours ago -
Write the ionic equations for the first stage of salts
hydrolysis.
Anion, Cation?
Na2S
NiSO4
K2SO4...
asked 4 hours ago -
suppose there is a normally distributed population with a mean of
250 and a standard deviation...
asked 4 hours ago -
Question Three
Suppose you as project manager are using the Waterfall
development methodology on a large...
asked 5 hours ago -
Which statement is not true about welfare in Canada?
A.Benefits typically vary based on one's ability...
asked 6 hours ago -
Please help me with FLOWCHART and UML diagram for class,
thank you!
#include <iostream>
#include <fstream>...
asked 7 hours ago -
3. Describe the “logic circuit” of the Lac operon. Which
proteins are bound or not to...
asked 7 hours ago -
Ayesha’s adjusted gross income is $60,000 in 2019. She donated a
piece of artwork with a...
asked 7 hours ago -
For Dijkstra’s shortest path algorithm:
a. Give the Big-O time for Dijkstra’s shortest path algorithm
and...
asked 7 hours ago