How would I calculate the changes in the selling prices per unit (television) using the data in Exhibit 1 and to calculate the profits that would have been reported in absence of accounting manipulations using the data in Exhibits 1 and 2.


Homework Answers
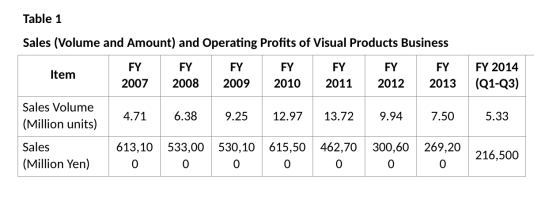
How would I calculate the changes in the selling prices per unit (television) using the data in Exhibit 1
To calculate thr selling prices using the sales and volume of units, we divide the total sales by the sales of units of every year.
| Item | FY 2007 | FY2008 | FY2009 | FY2010 | FY2011 | FY2012 | FY2013 | FY 2014(Q1-Q3) |
| sales volume(million units) | 4.71 | 6.38 | 9.25 | 12.97 | 13.72 | 9.94 | 7.5 | 5.33 |
| sales (million Yen) | 613,100.00 | 533,000.00 | 530,100.00 | 615,500.00 | 462,700.00 | 300,600.00 | 269,200.00 | 216,500.00 |
| operating profit(million Yen) | (13,500.00) | 1,300.00 | 3,800.00 | 3,200.00 | (53,500.00) | (48,100.00) | (26,100.00) | (35,400.00) |
| Selling price changes | 130,169.85 | 83,542.32 | 57,308.11 | 47,455.67 | 33,724.49 | 30,241.45 | 35,893.33 | 40,619.14 |
as it is shown above the price of the television units has had a decrease tendency going from $130,169.85 in 2007 to $30241.45 in 2012. on the other hand in 2013 and 2014, the price increased.
calculate the profits that would have been reported in absence of accounting manipulations using the data in Exhibits 1 and 2.
since the accounting manipulations only had the information about the carryovers available from the begining of FY2011, there is some retained profit that hasn´t been carried forward. that´s the one for the FY2008 and FY 2009. FY2010 rofit is shown in the exhibit 2, that´s why we aren´t going to use it in the calculation.
TO MAKE THE CALCULATION, we just have to add the three profit amounts that refer to FY2008 and 2009
| FY 2008 | FY 2009 | Profit that would´ve been reported | |||
| Operating profit (million Yen) | 1300 | 3800 | 5100 | ||
Add Answer to:
How would I calculate the changes in the selling prices per unit
(television) using the data...
What role did Toshiba’s (a) senior management and (b) junior employees play in Toshiba’s deceptive accounting?...
 What role did Toshiba’s (a) senior management and (b) junior
employees play in Toshiba’s deceptive accounting?
Nature and Amounts of Carryovers
Although the practice of carryovers probably began in FY 2008,
the Investigation Committee was able to obtain detailed information
about them only from the beginning of FY 2011. The carryover
balances at the end of fiscal years 2011 through 2014 are presented
in Table 2. The carryovers pertained to several different items,
which are explained next.
Methods related to...
What role did Toshiba’s (a) senior management and (b) junior
employees play in Toshiba’s deceptive accounting?
Nature and Amounts of Carryovers
Although the practice of carryovers probably began in FY 2008,
the Investigation Committee was able to obtain detailed information
about them only from the beginning of FY 2011. The carryover
balances at the end of fiscal years 2011 through 2014 are presented
in Table 2. The carryovers pertained to several different items,
which are explained next.
Methods related to...
What role did Toshiba’s target setting practices (“Challenges”) play in the irregular accounting practices described in...
 What role did Toshiba’s target setting practices (“Challenges”)
play in the irregular accounting practices described in the
case?
In an attempt to meet profit and loss targets, the Visual Products Business started using C/O (Carryover) techniques, probably from FY 2008 onwards. These techniques aimed to overstate the current profit by "failing to record a provision that should have been recorded or deferring the recording of operating expenses until the next or a later fiscal period” (The Report, page 199). In...
What role did Toshiba’s target setting practices (“Challenges”)
play in the irregular accounting practices described in the
case?
In an attempt to meet profit and loss targets, the Visual Products Business started using C/O (Carryover) techniques, probably from FY 2008 onwards. These techniques aimed to overstate the current profit by "failing to record a provision that should have been recorded or deferring the recording of operating expenses until the next or a later fiscal period” (The Report, page 199). In...
Please use own words. Thank you. CASE QUESTIONS AND DISCUSSION > Analyze and discuss the questions...
 Please use own words. Thank you.
CASE QUESTIONS AND DISCUSSION > Analyze and discuss the questions listed below in specific detail. A minimum of 4 pages is required; ensure that you answer all questions completely Case Questions Who are the main players (name and position)? What business (es) and industry or industries is the company in? What are the issues and problems facing the company? (Sort them by importance and urgency.) What are the characteristics of the environment in which...
Please use own words. Thank you.
CASE QUESTIONS AND DISCUSSION > Analyze and discuss the questions listed below in specific detail. A minimum of 4 pages is required; ensure that you answer all questions completely Case Questions Who are the main players (name and position)? What business (es) and industry or industries is the company in? What are the issues and problems facing the company? (Sort them by importance and urgency.) What are the characteristics of the environment in which...
 What role did Toshiba’s (a) senior management and (b) junior
employees play in Toshiba’s deceptive accounting?
Nature and Amounts of Carryovers
Although the practice of carryovers probably began in FY 2008,
the Investigation Committee was able to obtain detailed information
about them only from the beginning of FY 2011. The carryover
balances at the end of fiscal years 2011 through 2014 are presented
in Table 2. The carryovers pertained to several different items,
which are explained next.
Methods related to...
What role did Toshiba’s (a) senior management and (b) junior
employees play in Toshiba’s deceptive accounting?
Nature and Amounts of Carryovers
Although the practice of carryovers probably began in FY 2008,
the Investigation Committee was able to obtain detailed information
about them only from the beginning of FY 2011. The carryover
balances at the end of fiscal years 2011 through 2014 are presented
in Table 2. The carryovers pertained to several different items,
which are explained next.
Methods related to...
 What role did Toshiba’s target setting practices (“Challenges”)
play in the irregular accounting practices described in the
case?
In an attempt to meet profit and loss targets, the Visual Products Business started using C/O (Carryover) techniques, probably from FY 2008 onwards. These techniques aimed to overstate the current profit by "failing to record a provision that should have been recorded or deferring the recording of operating expenses until the next or a later fiscal period” (The Report, page 199). In...
What role did Toshiba’s target setting practices (“Challenges”)
play in the irregular accounting practices described in the
case?
In an attempt to meet profit and loss targets, the Visual Products Business started using C/O (Carryover) techniques, probably from FY 2008 onwards. These techniques aimed to overstate the current profit by "failing to record a provision that should have been recorded or deferring the recording of operating expenses until the next or a later fiscal period” (The Report, page 199). In...
 Please use own words. Thank you.
CASE QUESTIONS AND DISCUSSION > Analyze and discuss the questions listed below in specific detail. A minimum of 4 pages is required; ensure that you answer all questions completely Case Questions Who are the main players (name and position)? What business (es) and industry or industries is the company in? What are the issues and problems facing the company? (Sort them by importance and urgency.) What are the characteristics of the environment in which...
Please use own words. Thank you.
CASE QUESTIONS AND DISCUSSION > Analyze and discuss the questions listed below in specific detail. A minimum of 4 pages is required; ensure that you answer all questions completely Case Questions Who are the main players (name and position)? What business (es) and industry or industries is the company in? What are the issues and problems facing the company? (Sort them by importance and urgency.) What are the characteristics of the environment in which...
Most questions answered within 3 hours.
-
Draw a free body diagram of all the forces that act on a chain
of paper...
asked 9 minutes ago -
Consider an individual with the following utility function u(W)
= W^(1/4) and u(W) = W^(1/2)
Which...
asked 15 minutes ago -
Ion-interaction chromatography can be used to separate out
ions.(i) Discuss this mode of chromatography in terms...
asked 17 minutes ago -
Problem 16-05
Accounts Payable
A chain of appliance stores, APP Corporation, purchases
inventory with a net...
asked 19 minutes ago -
The shape of both C=CF2 groups in tetrafluoroethene molecule
(F2C=CF2) is __________, and the shape of...
asked 30 minutes ago -
A mass M = 10.0 kg falls through a height h = 1.00 m, whilst
attached...
asked 48 minutes ago -
2 H3BO3 (aq) + 3 Ba(OH)2 (aq) ---> Ba3(BO3)2 (aq) + 6 H2O
48.76 mL of...
asked 50 minutes ago -
Consider the reaction. 2A(g)↽−−⇀B(g)?p=1.17×10⁻⁵at 500 K If a
sample of A(g) A ( g ) at...
asked 48 minutes ago -
1.
Cybercrime:
a.
has been controlled by comprehensive federal legislation.
b.
is easy to detect.
c....
asked 49 minutes ago -
The retail price of a medium-sized box of a well-known brand of
cornflakes ranges from $3.14...
asked 53 minutes ago -
You want to freeze some homemade popsicles. You pour 0.24 kg of
juice at room temperature...
asked 1 hour ago -
In a Hall-effect experiment, a current of 2.2 A sent
lengthwise through a conductor 1.1 cm...
asked 1 hour ago