
Homework Answers
Add Answer to:
The mass spectrum of 3-bromopropanoic acid is shown below. Four peaks are labeled with A, B,...
The mass spectrum of 3-bromopropanoic acid is shown below. Four peaks are labeled with A, B,...
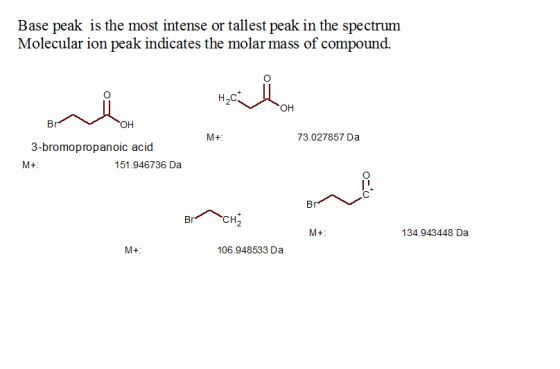
 The mass spectrum of 3-bromopropanoic acid is shown below. Four peaks are labeled with A, B, C, and D. Select the label for the base peak(s). 45 55 18 26 on 10 20 30 40 50 60 70 80 90 100 MIZ 110 120 130 140 150 160 170 The mass spectrum of 3-bromopropanoic acid is shown below. Four peaks are labeled with A, B, C, and D. Select the label for the M peak(s) (unfragmented parent). 135 27 45...
Suggest a composition for the halogen compound whose mass spectrum is shown below and assign the labeled peaks. 127 100 173 160 158 162 25 48 TITTHTT 160 170 91 208 79 35 160 173 30 40 50 60 70 80 90...
 Suggest a composition for the halogen compound whose mass
spectrum is shown below and assign the labeled peaks.
127 100 173 160 158 162 25 48 TITTHTT 160 170 91 208 79 35 160 173 30 40 50 60 70 80 90 100 110 120 130 140 150 160 170 180 190 200 210 m/z
127 100 173 160 158 162 25 48 TITTHTT 160 170 91 208 79 35 160 173 30 40 50 60 70 80 90 100...
Suggest a composition for the halogen compound whose mass
spectrum is shown below and assign the labeled peaks.
127 100 173 160 158 162 25 48 TITTHTT 160 170 91 208 79 35 160 173 30 40 50 60 70 80 90 100 110 120 130 140 150 160 170 180 190 200 210 m/z
127 100 173 160 158 162 25 48 TITTHTT 160 170 91 208 79 35 160 173 30 40 50 60 70 80 90 100...
Use the mass spectrum and either the NMR spectrum or the IR spectrum to deduce the...
 Use the mass spectrum and either the NMR spectrum or the IR
spectrum to deduce the structure of the following compound
(c) C8HO3H NMR, 300 MHz, 6.1 ppm (singlet, 2H), 6.9 ppm (doublet, 1H), and 7.3 ppm (singlet, 1H), 7.4 ppm (doublet, 1H), 9.8 ppm (singlet, 1H); significant IR absorbances at 1687, 1602, 1449, 1264, 1038, 929, and 815 cm1. 100 149 (150) 80 60 40 121 63 20 65 91 0 15 20 25 30 35 40 45 50...
Use the mass spectrum and either the NMR spectrum or the IR
spectrum to deduce the structure of the following compound
(c) C8HO3H NMR, 300 MHz, 6.1 ppm (singlet, 2H), 6.9 ppm (doublet, 1H), and 7.3 ppm (singlet, 1H), 7.4 ppm (doublet, 1H), 9.8 ppm (singlet, 1H); significant IR absorbances at 1687, 1602, 1449, 1264, 1038, 929, and 815 cm1. 100 149 (150) 80 60 40 121 63 20 65 91 0 15 20 25 30 35 40 45 50...
Deduce the ester compound structure with M/Z=136 on this mass spectrum; significant peaks at 51, 77,...
 Deduce the ester compound structure with M/Z=136 on this mass
spectrum; significant peaks at 51, 77, 105, 136.
Relative Abundance M(136) 25 30 35 40 45 50 55 60 65 70 75 80 85 90 95 100 105 110 115 120 125 130 135 140 mz
Deduce the ester compound structure with M/Z=136 on this mass
spectrum; significant peaks at 51, 77, 105, 136.
Relative Abundance M(136) 25 30 35 40 45 50 55 60 65 70 75 80 85 90 95 100 105 110 115 120 125 130 135 140 mz
8. (10 points) The following spectra correspond to compounds AE listed below con pound to its...
 8. (10 points) The following spectra correspond to compounds AE listed below con pound to its corresponding spestre Label very simal on the spectrum (as Co . ctc.). Spectrum CDCI, 190 160 170 160 150 140 130 120 110 100 80 80 Spectrum 2 70 80 50 40 30 20 10 O le CDCI, 190 180 170 180 150 140 130 120 110 100 90 80 70 60 50 40 30 20 10 O de CDCI, 190 180 170 180...
Spectroscopy of C5H10O 1. Correctly label 2 peaks in the IR spectrum with the appropriate functional...
 Spectroscopy of C5H10O
1. Correctly label 2 peaks in the IR spectrum with the appropriate functional group. 2. Correctly label 1 peak in the 13C NMR spectrum. 3. Draw some possible structures (isomers) as you analyze the 'H NMR spectrum. 4. Draw your final choice of structure to match the IR. 13C NMR, and H NMR 5. Label the different types of hydrogens on your structure as a, b, c, etc. Label the peaks in the 'H NMR spectrum with...
Spectroscopy of C5H10O
1. Correctly label 2 peaks in the IR spectrum with the appropriate functional group. 2. Correctly label 1 peak in the 13C NMR spectrum. 3. Draw some possible structures (isomers) as you analyze the 'H NMR spectrum. 4. Draw your final choice of structure to match the IR. 13C NMR, and H NMR 5. Label the different types of hydrogens on your structure as a, b, c, etc. Label the peaks in the 'H NMR spectrum with...
Identify which of these four mass spectra indicate the presence of sulfur, chlorine, bromine, iodine, or...
 Identify which of these four mass spectra indicate the presence of sulfur, chlorine, bromine, iodine, or nitrogen. Suggest a molecular formula for each. 100 abundance 8 $ 38 20 30 40 50 60 70 80 90 100 110 120 130 140 150 160 mily abundance 10 20 30 40 50 60 70 80 90 100 110 120 130 140 150 160 z 8 8 8 abundance $ 8 LL 10 20 30 40 50 60 70 80 90 100 110...
4. As discussed earlier fatty acids are often identified from the mass spectrum of the corresponding...
 4. As discussed earlier fatty acids are often identified from the mass spectrum of the corresponding methyl ester. Identify the fatty acid methyl ester (draw its structure) whose spectrum is shown below. Include the reasoning used to make your decision Abundance 143 w.w. Christie 155 L 50 ubom 80 90 101 129 o 100 110 120 130 140 150 160 17 180 160 170*180*** 60 70
Directly compare your own GCMS data to the three different stock GCMS data sets. CIGC Yukki...
 Directly compare your own GCMS data to the three different
stock GCMS data sets.
CIGC Yukki 7 10000 3.488 Spoctrum 102030405060为80 90 100 110 120 10 140 150 160 170 180 190 Spectrum Peak Repet TIC Area Ast 28a86 100 4.118 Page 1 of 3 10 20 30 40 60 Prak Repon TIC Are Anat 2 4117 Page 2 of 3 TIC 1.00 min Spectnan 0 10 20 0 70300 10 120 140 150 160 170 10 190 Spectrum 0...
Directly compare your own GCMS data to the three different
stock GCMS data sets.
CIGC Yukki 7 10000 3.488 Spoctrum 102030405060为80 90 100 110 120 10 140 150 160 170 180 190 Spectrum Peak Repet TIC Area Ast 28a86 100 4.118 Page 1 of 3 10 20 30 40 60 Prak Repon TIC Are Anat 2 4117 Page 2 of 3 TIC 1.00 min Spectnan 0 10 20 0 70300 10 120 140 150 160 170 10 190 Spectrum 0...
this is sec phenethyl alcohol, the nambers in this spectrum represent which structures? eg 77 is...
 this is sec phenethyl alcohol, the nambers in this spectrum
represent which structures? eg 77 is arene. what other numbers
are?
Spe Link: R.Time:7.04Scan:3138) MassPeaks: 114 Raw Mode: Averaged 70-7.003137-3139) BasePeak. 91(516216) BG Mode Cale from Peak Group 1 - Event 100- so 8x12:96 26 30 40 50 60 70 80 90 100 110 120 130 140 150 160 170 180 190 200 mz
this is sec phenethyl alcohol, the nambers in this spectrum
represent which structures? eg 77 is arene. what other numbers
are?
Spe Link: R.Time:7.04Scan:3138) MassPeaks: 114 Raw Mode: Averaged 70-7.003137-3139) BasePeak. 91(516216) BG Mode Cale from Peak Group 1 - Event 100- so 8x12:96 26 30 40 50 60 70 80 90 100 110 120 130 140 150 160 170 180 190 200 mz
 The mass spectrum of 3-bromopropanoic acid is shown below. Four peaks are labeled with A, B, C, and D. Select the label for the base peak(s). 45 55 18 26 on 10 20 30 40 50 60 70 80 90 100 MIZ 110 120 130 140 150 160 170 The mass spectrum of 3-bromopropanoic acid is shown below. Four peaks are labeled with A, B, C, and D. Select the label for the M peak(s) (unfragmented parent). 135 27 45...
 Suggest a composition for the halogen compound whose mass
spectrum is shown below and assign the labeled peaks.
127 100 173 160 158 162 25 48 TITTHTT 160 170 91 208 79 35 160 173 30 40 50 60 70 80 90 100 110 120 130 140 150 160 170 180 190 200 210 m/z
127 100 173 160 158 162 25 48 TITTHTT 160 170 91 208 79 35 160 173 30 40 50 60 70 80 90 100...
Suggest a composition for the halogen compound whose mass
spectrum is shown below and assign the labeled peaks.
127 100 173 160 158 162 25 48 TITTHTT 160 170 91 208 79 35 160 173 30 40 50 60 70 80 90 100 110 120 130 140 150 160 170 180 190 200 210 m/z
127 100 173 160 158 162 25 48 TITTHTT 160 170 91 208 79 35 160 173 30 40 50 60 70 80 90 100...
 Use the mass spectrum and either the NMR spectrum or the IR
spectrum to deduce the structure of the following compound
(c) C8HO3H NMR, 300 MHz, 6.1 ppm (singlet, 2H), 6.9 ppm (doublet, 1H), and 7.3 ppm (singlet, 1H), 7.4 ppm (doublet, 1H), 9.8 ppm (singlet, 1H); significant IR absorbances at 1687, 1602, 1449, 1264, 1038, 929, and 815 cm1. 100 149 (150) 80 60 40 121 63 20 65 91 0 15 20 25 30 35 40 45 50...
Use the mass spectrum and either the NMR spectrum or the IR
spectrum to deduce the structure of the following compound
(c) C8HO3H NMR, 300 MHz, 6.1 ppm (singlet, 2H), 6.9 ppm (doublet, 1H), and 7.3 ppm (singlet, 1H), 7.4 ppm (doublet, 1H), 9.8 ppm (singlet, 1H); significant IR absorbances at 1687, 1602, 1449, 1264, 1038, 929, and 815 cm1. 100 149 (150) 80 60 40 121 63 20 65 91 0 15 20 25 30 35 40 45 50...
 Deduce the ester compound structure with M/Z=136 on this mass
spectrum; significant peaks at 51, 77, 105, 136.
Relative Abundance M(136) 25 30 35 40 45 50 55 60 65 70 75 80 85 90 95 100 105 110 115 120 125 130 135 140 mz
Deduce the ester compound structure with M/Z=136 on this mass
spectrum; significant peaks at 51, 77, 105, 136.
Relative Abundance M(136) 25 30 35 40 45 50 55 60 65 70 75 80 85 90 95 100 105 110 115 120 125 130 135 140 mz
 8. (10 points) The following spectra correspond to compounds AE listed below con pound to its corresponding spestre Label very simal on the spectrum (as Co . ctc.). Spectrum CDCI, 190 160 170 160 150 140 130 120 110 100 80 80 Spectrum 2 70 80 50 40 30 20 10 O le CDCI, 190 180 170 180 150 140 130 120 110 100 90 80 70 60 50 40 30 20 10 O de CDCI, 190 180 170 180...
 Spectroscopy of C5H10O
1. Correctly label 2 peaks in the IR spectrum with the appropriate functional group. 2. Correctly label 1 peak in the 13C NMR spectrum. 3. Draw some possible structures (isomers) as you analyze the 'H NMR spectrum. 4. Draw your final choice of structure to match the IR. 13C NMR, and H NMR 5. Label the different types of hydrogens on your structure as a, b, c, etc. Label the peaks in the 'H NMR spectrum with...
Spectroscopy of C5H10O
1. Correctly label 2 peaks in the IR spectrum with the appropriate functional group. 2. Correctly label 1 peak in the 13C NMR spectrum. 3. Draw some possible structures (isomers) as you analyze the 'H NMR spectrum. 4. Draw your final choice of structure to match the IR. 13C NMR, and H NMR 5. Label the different types of hydrogens on your structure as a, b, c, etc. Label the peaks in the 'H NMR spectrum with...
 Identify which of these four mass spectra indicate the presence of sulfur, chlorine, bromine, iodine, or nitrogen. Suggest a molecular formula for each. 100 abundance 8 $ 38 20 30 40 50 60 70 80 90 100 110 120 130 140 150 160 mily abundance 10 20 30 40 50 60 70 80 90 100 110 120 130 140 150 160 z 8 8 8 abundance $ 8 LL 10 20 30 40 50 60 70 80 90 100 110...
 4. As discussed earlier fatty acids are often identified from the mass spectrum of the corresponding methyl ester. Identify the fatty acid methyl ester (draw its structure) whose spectrum is shown below. Include the reasoning used to make your decision Abundance 143 w.w. Christie 155 L 50 ubom 80 90 101 129 o 100 110 120 130 140 150 160 17 180 160 170*180*** 60 70
 Directly compare your own GCMS data to the three different
stock GCMS data sets.
CIGC Yukki 7 10000 3.488 Spoctrum 102030405060为80 90 100 110 120 10 140 150 160 170 180 190 Spectrum Peak Repet TIC Area Ast 28a86 100 4.118 Page 1 of 3 10 20 30 40 60 Prak Repon TIC Are Anat 2 4117 Page 2 of 3 TIC 1.00 min Spectnan 0 10 20 0 70300 10 120 140 150 160 170 10 190 Spectrum 0...
Directly compare your own GCMS data to the three different
stock GCMS data sets.
CIGC Yukki 7 10000 3.488 Spoctrum 102030405060为80 90 100 110 120 10 140 150 160 170 180 190 Spectrum Peak Repet TIC Area Ast 28a86 100 4.118 Page 1 of 3 10 20 30 40 60 Prak Repon TIC Are Anat 2 4117 Page 2 of 3 TIC 1.00 min Spectnan 0 10 20 0 70300 10 120 140 150 160 170 10 190 Spectrum 0...
 this is sec phenethyl alcohol, the nambers in this spectrum
represent which structures? eg 77 is arene. what other numbers
are?
Spe Link: R.Time:7.04Scan:3138) MassPeaks: 114 Raw Mode: Averaged 70-7.003137-3139) BasePeak. 91(516216) BG Mode Cale from Peak Group 1 - Event 100- so 8x12:96 26 30 40 50 60 70 80 90 100 110 120 130 140 150 160 170 180 190 200 mz
this is sec phenethyl alcohol, the nambers in this spectrum
represent which structures? eg 77 is arene. what other numbers
are?
Spe Link: R.Time:7.04Scan:3138) MassPeaks: 114 Raw Mode: Averaged 70-7.003137-3139) BasePeak. 91(516216) BG Mode Cale from Peak Group 1 - Event 100- so 8x12:96 26 30 40 50 60 70 80 90 100 110 120 130 140 150 160 170 180 190 200 mz
Most questions answered within 3 hours.
-
Write the ionic equations for the first stage of salts
hydrolysis.
Anion, Cation?
Na2S
NiSO4
K2SO4...
asked 5 minutes ago -
suppose there is a normally distributed population with a mean of
250 and a standard deviation...
asked 48 minutes ago -
Question Three
Suppose you as project manager are using the Waterfall
development methodology on a large...
asked 1 hour ago -
Which statement is not true about welfare in Canada?
A.Benefits typically vary based on one's ability...
asked 2 hours ago -
Please help me with FLOWCHART and UML diagram for class,
thank you!
#include <iostream>
#include <fstream>...
asked 3 hours ago -
3. Describe the “logic circuit” of the Lac operon. Which
proteins are bound or not to...
asked 3 hours ago -
Ayesha’s adjusted gross income is $60,000 in 2019. She donated a
piece of artwork with a...
asked 3 hours ago -
For Dijkstra’s shortest path algorithm:
a. Give the Big-O time for Dijkstra’s shortest path algorithm
and...
asked 3 hours ago -
Phosphorus violates the 'octet rule' in biological molecules,
forming more covalent bonds than expected based on...
asked 3 hours ago -
A 1.3 eV electron has a 10-4 probability of tunneling
through a 2.4 eV potential barrier....
asked 3 hours ago -
What is the one ingredient that is common to being successful
with all stakeholders?
profit
trust...
asked 3 hours ago -
Write an assembly language 32 bit program that reads in lines of
text by a .txt...
asked 3 hours ago