
Homework Answers
The graph in Figure 1 shows the displacement versus position for the wave at t =...
 The graph in Figure 1 shows the displacement versus position for
the wave at t = 1:0 s. The graph in Figure 2 shows the displacement
versus time for the wave at x = 1:0 m. Determine the displacement
equation D(x,t) and the velocity of the wave. SHOW WORK
Plnti Plot: Figure 1: D(x) (m) vrs. r (m) Figure 2: D(t) (m) vrs. t (s) igure I: D(c) (m) vrs. m
The graph in Figure 1 shows the displacement versus position for
the wave at t = 1:0 s. The graph in Figure 2 shows the displacement
versus time for the wave at x = 1:0 m. Determine the displacement
equation D(x,t) and the velocity of the wave. SHOW WORK
Plnti Plot: Figure 1: D(x) (m) vrs. r (m) Figure 2: D(t) (m) vrs. t (s) igure I: D(c) (m) vrs. m
Due date: Thu Jan 31 11:59:59 pm 2019 (EST) (hrw8c2p90) A train started from rest and...
 Due date: Thu Jan 31 11:59:59 pm 2019 (EST) (hrw8c2p90) A train started from rest and moved with con- stant acceleration. At one time it was traveling vo 30.00 m /s, and 170.0 m farther on it was traveling v = 55.00 m/s. Calculate the acceleration. m is Tries 0/8 Calculate the time required to travel the 170.0 m mentioned. Tries 0/8 Calculate the time required to attain the speed of 30.00 m/s. Tries 0/8 Calculate the distance moved from...
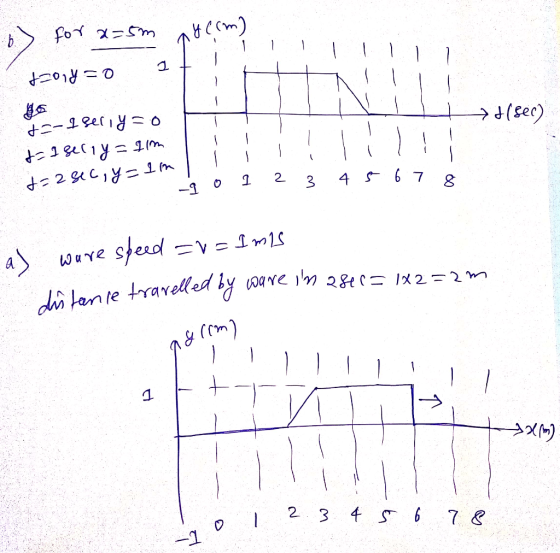
(2) A wave passes your house (considered to be x “ 0), and you start your...
(2) A wave passes your house (considered to be x “ 0), and you start your stopwatch as the wave passes (marking t “ 0). It is traveling at a speed of 50 m/s in the negative-x direction. The displacement of the wave as it passes your house is 4 m even though its amplitude is 6m. It has a frequency of 2 Hz. (a) Write the equation for the displacement of this wave as a function of position and...
Question 33 (1 point) A wave is traveling with a speed v along the x axis...
 Question 33 (1 point) A wave is traveling with a speed v along the x axis in the positive direction. The upper graph shows the displacement y versus the distance x for a given instant of time. The lower graph shows the displacement y versus the time t for any given point x. From the information in the 57.m graphs, what is the wave speed v? 8.0 m/s O not enough information provided to solve the problem 6.0 ms/ 4.0...
1. The left figure is a history graph that shows the displacement D of a traveling wave at a given position as a function of time. The right figure is a snapshot graph that shows the displacement...
 1. The left figure is a history graph that shows the displacement D of a traveling wave at a given position as a function of time. The right figure is a snapshot graph that shows the displacement of the same wave as a function of position. D (cm) D (cm) -1 -2 2/3 4 67 8 -2 (a) Determine the period T, the frequency f, and the angular frequency o for this wave. (b) Determine the wavelength 2, wavenumber K,...
#4 Angeles FIGURE P2.2 a. Who 3. Il The b. How e position graph of Figure...
 #4
Angeles FIGURE P2.2 a. Who 3. Il The b. How e position graph of Figure P2.3 shows a dog slowly sneak- ng up on a squirrel, then putting on a burst or the lower sped? 10. Il Richa are on th Normall ning late How ma a. For how many seconds does the dog move at the slower b. Draw the velocity-ve dog's velocity-versus-time graph. Include a numerical scale on both axes. 11. Il In a 5 another to...
#4
Angeles FIGURE P2.2 a. Who 3. Il The b. How e position graph of Figure P2.3 shows a dog slowly sneak- ng up on a squirrel, then putting on a burst or the lower sped? 10. Il Richa are on th Normall ning late How ma a. For how many seconds does the dog move at the slower b. Draw the velocity-ve dog's velocity-versus-time graph. Include a numerical scale on both axes. 11. Il In a 5 another to...
HELP NEEDED!!!!!!! especially with the graphing for objects 1 and 2 together and object 3 squared. People are getting different graphs and I do not know if it is correct. Also SIG FIGS in analysis. TH...
 HELP NEEDED!!!!!!! especially with the graphing for objects 1
and 2 together and object 3 squared. People are getting different
graphs and I do not know if it is correct. Also SIG FIGS in
analysis. THANK YOU IN ADVANCE
Part 1 - Velocity Position versus Time (x vs t) graph for Object 1 x versust-Object 1 y 1.2754x+ 0.0187 x (m) Linear (x (m)) 0 Position versus Time (x vs t) graph for Object 2 x versus t-Object 2 4.5...
HELP NEEDED!!!!!!! especially with the graphing for objects 1
and 2 together and object 3 squared. People are getting different
graphs and I do not know if it is correct. Also SIG FIGS in
analysis. THANK YOU IN ADVANCE
Part 1 - Velocity Position versus Time (x vs t) graph for Object 1 x versust-Object 1 y 1.2754x+ 0.0187 x (m) Linear (x (m)) 0 Position versus Time (x vs t) graph for Object 2 x versus t-Object 2 4.5...
A particle's position on the x-axis is given by the function (3t-4t+1) m a) Make a...
 A particle's position on the x-axis is given by the function (3t-4t+1) m a) Make a position-versus time graph for the interval 0< t <5 (time is measured in seconds) b) Determine the particle's velocity at t = 2 s c) Are there any turning points in the particle's motion? If so, in what position or positions? d) Where is the particle when Vx=8 m/s? e) Draw the velocity-versus time graph for the interval 0< t <5 (time is measured...
Feb. 6, 2017 PHYS 1201 page 4 of 6 Midterm #1 Feb. 6,2017 Long Problems Note...
 Feb. 6, 2017 PHYS 1201 page 4 of 6 Midterm #1 Feb. 6,2017 Long Problems Note that all quantities are given to 3 significant figures. Answers s appropriate number of significant figures hould be given to an P1. Below is a snapshot graph att 0 of m/s. a wave on a rope. The wave is traveling to the right at 24.0 y (cm) 4 id 3 5 6 8 9 10/x (m) a) Write the function, y(ax, t), that describes...
I need help with these two problems, I know how to find the phase shift I...
 I need help with these two problems, I know how to find the
phase shift I got pi/4, and for the first question I know it shifts
to the right and the second problem shifts to the left, but I want
to know how you determine whether the shift is moving left or
right
Two graphs that depict a one dimensional water wave, as a function of position, at two separate times (at 1-0 s and t = 1.0 s)...
I need help with these two problems, I know how to find the
phase shift I got pi/4, and for the first question I know it shifts
to the right and the second problem shifts to the left, but I want
to know how you determine whether the shift is moving left or
right
Two graphs that depict a one dimensional water wave, as a function of position, at two separate times (at 1-0 s and t = 1.0 s)...
 The graph in Figure 1 shows the displacement versus position for
the wave at t = 1:0 s. The graph in Figure 2 shows the displacement
versus time for the wave at x = 1:0 m. Determine the displacement
equation D(x,t) and the velocity of the wave. SHOW WORK
Plnti Plot: Figure 1: D(x) (m) vrs. r (m) Figure 2: D(t) (m) vrs. t (s) igure I: D(c) (m) vrs. m
The graph in Figure 1 shows the displacement versus position for
the wave at t = 1:0 s. The graph in Figure 2 shows the displacement
versus time for the wave at x = 1:0 m. Determine the displacement
equation D(x,t) and the velocity of the wave. SHOW WORK
Plnti Plot: Figure 1: D(x) (m) vrs. r (m) Figure 2: D(t) (m) vrs. t (s) igure I: D(c) (m) vrs. m
 Due date: Thu Jan 31 11:59:59 pm 2019 (EST) (hrw8c2p90) A train started from rest and moved with con- stant acceleration. At one time it was traveling vo 30.00 m /s, and 170.0 m farther on it was traveling v = 55.00 m/s. Calculate the acceleration. m is Tries 0/8 Calculate the time required to travel the 170.0 m mentioned. Tries 0/8 Calculate the time required to attain the speed of 30.00 m/s. Tries 0/8 Calculate the distance moved from...
 Question 33 (1 point) A wave is traveling with a speed v along the x axis in the positive direction. The upper graph shows the displacement y versus the distance x for a given instant of time. The lower graph shows the displacement y versus the time t for any given point x. From the information in the 57.m graphs, what is the wave speed v? 8.0 m/s O not enough information provided to solve the problem 6.0 ms/ 4.0...
 1. The left figure is a history graph that shows the displacement D of a traveling wave at a given position as a function of time. The right figure is a snapshot graph that shows the displacement of the same wave as a function of position. D (cm) D (cm) -1 -2 2/3 4 67 8 -2 (a) Determine the period T, the frequency f, and the angular frequency o for this wave. (b) Determine the wavelength 2, wavenumber K,...
 #4
Angeles FIGURE P2.2 a. Who 3. Il The b. How e position graph of Figure P2.3 shows a dog slowly sneak- ng up on a squirrel, then putting on a burst or the lower sped? 10. Il Richa are on th Normall ning late How ma a. For how many seconds does the dog move at the slower b. Draw the velocity-ve dog's velocity-versus-time graph. Include a numerical scale on both axes. 11. Il In a 5 another to...
#4
Angeles FIGURE P2.2 a. Who 3. Il The b. How e position graph of Figure P2.3 shows a dog slowly sneak- ng up on a squirrel, then putting on a burst or the lower sped? 10. Il Richa are on th Normall ning late How ma a. For how many seconds does the dog move at the slower b. Draw the velocity-ve dog's velocity-versus-time graph. Include a numerical scale on both axes. 11. Il In a 5 another to...
 HELP NEEDED!!!!!!! especially with the graphing for objects 1
and 2 together and object 3 squared. People are getting different
graphs and I do not know if it is correct. Also SIG FIGS in
analysis. THANK YOU IN ADVANCE
Part 1 - Velocity Position versus Time (x vs t) graph for Object 1 x versust-Object 1 y 1.2754x+ 0.0187 x (m) Linear (x (m)) 0 Position versus Time (x vs t) graph for Object 2 x versus t-Object 2 4.5...
HELP NEEDED!!!!!!! especially with the graphing for objects 1
and 2 together and object 3 squared. People are getting different
graphs and I do not know if it is correct. Also SIG FIGS in
analysis. THANK YOU IN ADVANCE
Part 1 - Velocity Position versus Time (x vs t) graph for Object 1 x versust-Object 1 y 1.2754x+ 0.0187 x (m) Linear (x (m)) 0 Position versus Time (x vs t) graph for Object 2 x versus t-Object 2 4.5...
 A particle's position on the x-axis is given by the function (3t-4t+1) m a) Make a position-versus time graph for the interval 0< t <5 (time is measured in seconds) b) Determine the particle's velocity at t = 2 s c) Are there any turning points in the particle's motion? If so, in what position or positions? d) Where is the particle when Vx=8 m/s? e) Draw the velocity-versus time graph for the interval 0< t <5 (time is measured...
 Feb. 6, 2017 PHYS 1201 page 4 of 6 Midterm #1 Feb. 6,2017 Long Problems Note that all quantities are given to 3 significant figures. Answers s appropriate number of significant figures hould be given to an P1. Below is a snapshot graph att 0 of m/s. a wave on a rope. The wave is traveling to the right at 24.0 y (cm) 4 id 3 5 6 8 9 10/x (m) a) Write the function, y(ax, t), that describes...
 I need help with these two problems, I know how to find the
phase shift I got pi/4, and for the first question I know it shifts
to the right and the second problem shifts to the left, but I want
to know how you determine whether the shift is moving left or
right
Two graphs that depict a one dimensional water wave, as a function of position, at two separate times (at 1-0 s and t = 1.0 s)...
I need help with these two problems, I know how to find the
phase shift I got pi/4, and for the first question I know it shifts
to the right and the second problem shifts to the left, but I want
to know how you determine whether the shift is moving left or
right
Two graphs that depict a one dimensional water wave, as a function of position, at two separate times (at 1-0 s and t = 1.0 s)...
Most questions answered within 3 hours.
-
7.
________ involves individuals trading goods they already have or
providing services in exchange for something...
asked 26 seconds from now -
Share your research problem. What databases did you search as
you gathered evidence to support your...
asked 27 seconds from now -
what process occurs to form microspores and megaspores in flowering
plants?
asked 6 minutes ago -
C++
I need to use the function getData to put in all my data using
arrays....
asked 6 minutes ago -
A block is hung by a string from the inside roof of a van. When
the...
asked 13 minutes ago -
Do you think companies should not go for long term debt in their
capital structure to...
asked 21 minutes ago -
I create an address book where the user enters the name, phone
and email in the...
asked 27 minutes ago -
The production capacity for acrylonitrile
(C3H3N) in the United States exceeds 2
million pounds per year....
asked 35 minutes ago -
explain and comment out your answer
43. How many address lines are required to address a...
asked 41 minutes ago -
A sample of 45 observations is selected from a normal
population. The sample mean is 49,...
asked 56 minutes ago -
A construction company is planning to bid on a building
contract. The bid costs the company...
asked 53 minutes ago -
A firm operating in a purely competitive environment is faced
with a market price of $250....
asked 1 hour ago