


Homework Answers
79725 , 12862 , 18022 , 76712 , 256440 , 14013 , 46083 , 6808 , 85781 , 1251 , 6081 , 50397 , 11020 , 13633 , 1064 , 496433 , 25308 , 6616 , 11210 , 13900
.
(a)
Mean is calculated by adding all the 20 values and dividing the sum by 20.
To find out the median, the 20 values are arranged in increasing order at first and the average of 10th and 11th value is the median.
Variance is calculated by adding the squares of all the values an dividing the sum by 20, and then subtracting the square of the mean from it. Standard deviation is the square root of variance.
mean = 61667.95
median = 13956.5
standard deviation = 114563.1299
.
(b)
To find out the 25th percentile or the lower quartile, the 20 values are arranged in increasing order at first and the average of 5th and 6th value is the lower quartie.
The 50th percentile is the median.
To find out the 75th percentile or the upper quartile, the 20 values are arranged in increasing order at first and the average of 15th and 16th value is the upper quartile.
25th percentile = 8914
50th percentile = 13956.5
75th percentile = 63554.5
.
(c)
 .
.
(d)
Logarithmic transformation :-
11.286338 , 9.462033 , 9.799349 , 11.247813 , 12.454650 , 9.547741 , 10.738199 , 8.825854 , 11.359553 , 7.131699 , 8.712924 , 10.827687 , 9.307467 , 9.520249 , 6.969791 , 13.115204 , 10.138876 , 8.797246 , 9.324562 , 9.539644
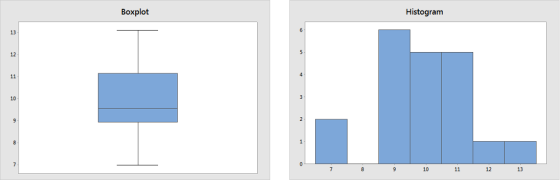
No
Logarithmic transformation does not result in somewhat symmetric distribution.
From the box plot it can be seen that lower quartile is much nearer to the median than the upper quartile. Also from the histogram it is evident that the data is positively skewed.
Add Answer to:
ribution by taking a transformation of the data. For the data shown below, take the natural...
Why is it appropriate to connect the data points for graph 1 (absorbance vs wavelength) but...
 Why is it appropriate to connect the data points for graph 1
(absorbance vs wavelength) but not appropriate for graph 2
(absorbance vs concentration)? What type of information does each
graph convey?
Absorbance vs Wavelength 0.55 0.50 0.45 0.40 0.15 0.30 Absorbance 0.25 0.20 0.15 0.10 . 0.00 380 400 4200 460 480 500 520 540 560 580 600 620 640 660 680 700 720 700 750 780 Wavelength Absorbance vs Concentration 0.45 y = 0.002 x 0.002 R=0.9997 0.40...
Why is it appropriate to connect the data points for graph 1
(absorbance vs wavelength) but not appropriate for graph 2
(absorbance vs concentration)? What type of information does each
graph convey?
Absorbance vs Wavelength 0.55 0.50 0.45 0.40 0.15 0.30 Absorbance 0.25 0.20 0.15 0.10 . 0.00 380 400 4200 460 480 500 520 540 560 580 600 620 640 660 680 700 720 700 750 780 Wavelength Absorbance vs Concentration 0.45 y = 0.002 x 0.002 R=0.9997 0.40...
Find the spring constant for the given data in the static method by plotting Displacement (along...
Find the spring constant for the given data in the static method by plotting Displacement (along y-axis) vs. Added Mass (along x-axis). Recall: the slope of the trend line corresponds to g/k. Copy and paste your graph here. (2 pts) Added Mass (kg) Displacement (m) 0.05 0.11 0.10 0.20 0.15 0.31 0.20 0.43 0.25 0.54 0.30 0.62 0.35 0.78 0.40 0.90 Again, find the spring constant for the same spring using the dynamic method, i.e. by plotting T2 (along y-axis)...
please see instruction in pictures 3) Calculations: to be completed on one side of engineering paper must be neat and must include: a) Drawn to scale, a cross section of your member- inclu...
 please see instruction in pictures
3) Calculations: to be completed on one side of engineering paper must be neat and must include: a) Drawn to scale, a cross section of your member- include all dimensions for your case Hand calculations of Area, A, (in), Location of the Centroid, ỹ, (X-X), Moment of inertia, l (in*), Section Modulus, S Using bottom center of the given cross section as an origin, list all the coordinates in tabular form for the critical intersections...
please see instruction in pictures
3) Calculations: to be completed on one side of engineering paper must be neat and must include: a) Drawn to scale, a cross section of your member- include all dimensions for your case Hand calculations of Area, A, (in), Location of the Centroid, ỹ, (X-X), Moment of inertia, l (in*), Section Modulus, S Using bottom center of the given cross section as an origin, list all the coordinates in tabular form for the critical intersections...
Below are the mass spectrum, IR spectrum, and 1H NMR spectrum for an unknown compound X....
 Below are the mass spectrum, IR spectrum, and 1H NMR spectrum
for an unknown compound X. Identify and give the systematic name
for X. For full marks, rationalize every piece of data.
0.15 10.45 A (9) 4.15 +0.40 0.10 +0.35 -0.05 +0.30 0.00 0.25 4.19 4.18 4.17 4.16 4.15 4.14 4.13 4.12 4.11 4.10 1.24 1.23 1.22 1.21 1.20 1.19 1.18 0.20 +0.15 F0.10 0.05 0.00 2.00 2.00 3.00 10 . 4,5 . 4.0 . 3.5 . 30 . 2,5...
Below are the mass spectrum, IR spectrum, and 1H NMR spectrum
for an unknown compound X. Identify and give the systematic name
for X. For full marks, rationalize every piece of data.
0.15 10.45 A (9) 4.15 +0.40 0.10 +0.35 -0.05 +0.30 0.00 0.25 4.19 4.18 4.17 4.16 4.15 4.14 4.13 4.12 4.11 4.10 1.24 1.23 1.22 1.21 1.20 1.19 1.18 0.20 +0.15 F0.10 0.05 0.00 2.00 2.00 3.00 10 . 4,5 . 4.0 . 3.5 . 30 . 2,5...
2-22 A beam is supported and loaded as shown in Figure P2-11d. For the data given in the assigned...
 2-22 A beam is supported and loaded as shown in Figure P2-11d. For the data given in the assigned row(s) in Table P2-2, find the static safety factor (a) If the beam is a ductile material with Sy 300 MPa (b) If the beam is a cast-brittle material with Su- 150 MPa, Sue 570 MPa ea Ri R2 R1 W' .t Ri R2 Table Use only data relevant to the particular problem. Lengths in m, forces in N, in m4...
Math shown is statistics 2.2 Graphical Methods for Describing Quantitative Data 1. Consider the stem-and-leaf display...
 Math shown is statistics
2.2 Graphical Methods for Describing Quantitative Data 1. Consider the stem-and-leaf display below, leaf unit-0.1 Stem Leaf 0 012 1 2248 2 1134599 3 00036 4 457 5 13 How many observations in the data set? How do you decide? yhe mwntbers a) b) Re-create all numbers, order them in descending order. c) Construct a dot plot. The following relative frequency table is for a data set of 300 observations. a) 2. Fill the frequency column...
Math shown is statistics
2.2 Graphical Methods for Describing Quantitative Data 1. Consider the stem-and-leaf display below, leaf unit-0.1 Stem Leaf 0 012 1 2248 2 1134599 3 00036 4 457 5 13 How many observations in the data set? How do you decide? yhe mwntbers a) b) Re-create all numbers, order them in descending order. c) Construct a dot plot. The following relative frequency table is for a data set of 300 observations. a) 2. Fill the frequency column...
The following partial MINITAB regression output for the Fresh detergent data relates to predicting demand for...
 The following partial MINITAB regression output for the Fresh detergent data relates to predicting demand for future sales periods in which the price difference will be. 10 Predicted Values for New Observations New ObsFit SE Fit 1 8 .0806 0.0648 2 8 .4804 0.0586 95% CI (7.9479, 8.2133) (8.3604, 8.6004) 95% PI (7.4187, 8.7425) (7.8209, 9.1398) Click here for the Excel Data File (a) Report a point estimate of and a 95 percent confidence interval for the mean demand for...
R Take Test: Hw1 Probability an x Find The Median For The Giver x+ ← →...
 R Take Test: Hw1 Probability an x Find The Median For The Giver x+ ← → С 을 https://elearning.uaeu.ac.ae/webapps/assessment/takelaunch.jsp?course assessment id--79759 1&courseid- 115789 18content id_-2265405_1&step-null ☆ y Question Completion Status: QUESTION 5 1 points Save Answer A nurse measured the blood pressure of each person who visited her clinic. Following is a relative-frequency histogram for the systolic blood pressure readings for those people aged between 25 and 40. Use the histogram to answer the question. The blood pressure readings were...
This Question: 1 pt 32 of 36 (0 complete) Use a table of 2-scores and percentiles...
 This Question: 1 pt 32 of 36 (0 complete) Use a table of 2-scores and percentiles to find the percentage to the nearest whole percentage) of data items in a normal distribution that lie between the following two z-scores. z= 1 and 22 Click the icon to view a table of z-scores and percentiles Table of z-Scores and Percentiles A. 6% OB. 8% O c. 149 OD. 12% .. -25 Scores and Percedes -Score Percentile t-Score Percentile Score Percentile Score...
In this experiment you will apply your knowledge of Conservation of Energy to a given data...
In this experiment you will apply your knowledge of Conservation of Energy to a given data set. Table 5 contains data for the position of a ball with mass 0.5 kg that has been dropped from 5 meters from rest at given time points. In order to test the conservation of energy, the potential energy and kinetic energy of the ball need to be calculated. Please help me fill in the rest of the values for the table (and understand...
 Why is it appropriate to connect the data points for graph 1
(absorbance vs wavelength) but not appropriate for graph 2
(absorbance vs concentration)? What type of information does each
graph convey?
Absorbance vs Wavelength 0.55 0.50 0.45 0.40 0.15 0.30 Absorbance 0.25 0.20 0.15 0.10 . 0.00 380 400 4200 460 480 500 520 540 560 580 600 620 640 660 680 700 720 700 750 780 Wavelength Absorbance vs Concentration 0.45 y = 0.002 x 0.002 R=0.9997 0.40...
Why is it appropriate to connect the data points for graph 1
(absorbance vs wavelength) but not appropriate for graph 2
(absorbance vs concentration)? What type of information does each
graph convey?
Absorbance vs Wavelength 0.55 0.50 0.45 0.40 0.15 0.30 Absorbance 0.25 0.20 0.15 0.10 . 0.00 380 400 4200 460 480 500 520 540 560 580 600 620 640 660 680 700 720 700 750 780 Wavelength Absorbance vs Concentration 0.45 y = 0.002 x 0.002 R=0.9997 0.40...
 please see instruction in pictures
3) Calculations: to be completed on one side of engineering paper must be neat and must include: a) Drawn to scale, a cross section of your member- include all dimensions for your case Hand calculations of Area, A, (in), Location of the Centroid, ỹ, (X-X), Moment of inertia, l (in*), Section Modulus, S Using bottom center of the given cross section as an origin, list all the coordinates in tabular form for the critical intersections...
please see instruction in pictures
3) Calculations: to be completed on one side of engineering paper must be neat and must include: a) Drawn to scale, a cross section of your member- include all dimensions for your case Hand calculations of Area, A, (in), Location of the Centroid, ỹ, (X-X), Moment of inertia, l (in*), Section Modulus, S Using bottom center of the given cross section as an origin, list all the coordinates in tabular form for the critical intersections...
 Below are the mass spectrum, IR spectrum, and 1H NMR spectrum
for an unknown compound X. Identify and give the systematic name
for X. For full marks, rationalize every piece of data.
0.15 10.45 A (9) 4.15 +0.40 0.10 +0.35 -0.05 +0.30 0.00 0.25 4.19 4.18 4.17 4.16 4.15 4.14 4.13 4.12 4.11 4.10 1.24 1.23 1.22 1.21 1.20 1.19 1.18 0.20 +0.15 F0.10 0.05 0.00 2.00 2.00 3.00 10 . 4,5 . 4.0 . 3.5 . 30 . 2,5...
Below are the mass spectrum, IR spectrum, and 1H NMR spectrum
for an unknown compound X. Identify and give the systematic name
for X. For full marks, rationalize every piece of data.
0.15 10.45 A (9) 4.15 +0.40 0.10 +0.35 -0.05 +0.30 0.00 0.25 4.19 4.18 4.17 4.16 4.15 4.14 4.13 4.12 4.11 4.10 1.24 1.23 1.22 1.21 1.20 1.19 1.18 0.20 +0.15 F0.10 0.05 0.00 2.00 2.00 3.00 10 . 4,5 . 4.0 . 3.5 . 30 . 2,5...
 2-22 A beam is supported and loaded as shown in Figure P2-11d. For the data given in the assigned row(s) in Table P2-2, find the static safety factor (a) If the beam is a ductile material with Sy 300 MPa (b) If the beam is a cast-brittle material with Su- 150 MPa, Sue 570 MPa ea Ri R2 R1 W' .t Ri R2 Table Use only data relevant to the particular problem. Lengths in m, forces in N, in m4...
 Math shown is statistics
2.2 Graphical Methods for Describing Quantitative Data 1. Consider the stem-and-leaf display below, leaf unit-0.1 Stem Leaf 0 012 1 2248 2 1134599 3 00036 4 457 5 13 How many observations in the data set? How do you decide? yhe mwntbers a) b) Re-create all numbers, order them in descending order. c) Construct a dot plot. The following relative frequency table is for a data set of 300 observations. a) 2. Fill the frequency column...
Math shown is statistics
2.2 Graphical Methods for Describing Quantitative Data 1. Consider the stem-and-leaf display below, leaf unit-0.1 Stem Leaf 0 012 1 2248 2 1134599 3 00036 4 457 5 13 How many observations in the data set? How do you decide? yhe mwntbers a) b) Re-create all numbers, order them in descending order. c) Construct a dot plot. The following relative frequency table is for a data set of 300 observations. a) 2. Fill the frequency column...
 The following partial MINITAB regression output for the Fresh detergent data relates to predicting demand for future sales periods in which the price difference will be. 10 Predicted Values for New Observations New ObsFit SE Fit 1 8 .0806 0.0648 2 8 .4804 0.0586 95% CI (7.9479, 8.2133) (8.3604, 8.6004) 95% PI (7.4187, 8.7425) (7.8209, 9.1398) Click here for the Excel Data File (a) Report a point estimate of and a 95 percent confidence interval for the mean demand for...
 R Take Test: Hw1 Probability an x Find The Median For The Giver x+ ← → С 을 https://elearning.uaeu.ac.ae/webapps/assessment/takelaunch.jsp?course assessment id--79759 1&courseid- 115789 18content id_-2265405_1&step-null ☆ y Question Completion Status: QUESTION 5 1 points Save Answer A nurse measured the blood pressure of each person who visited her clinic. Following is a relative-frequency histogram for the systolic blood pressure readings for those people aged between 25 and 40. Use the histogram to answer the question. The blood pressure readings were...
 This Question: 1 pt 32 of 36 (0 complete) Use a table of 2-scores and percentiles to find the percentage to the nearest whole percentage) of data items in a normal distribution that lie between the following two z-scores. z= 1 and 22 Click the icon to view a table of z-scores and percentiles Table of z-Scores and Percentiles A. 6% OB. 8% O c. 149 OD. 12% .. -25 Scores and Percedes -Score Percentile t-Score Percentile Score Percentile Score...
Most questions answered within 3 hours.
-
26) Briefly describe, using words or simple diagrams, the
chemiosmotic theory for coupling oxidation to phosphorylation...
asked 1 hour ago -
Suppose that XX is a random variable with mean 16 and standard
deviation 5 . Also...
asked 2 hours ago -
Calculate the number density of argon gas at a temperature of
24C and a pressure of...
asked 5 hours ago -
Alternative
Classification
How to Estimate
Probabilities from Data? ( For continuous Attributes)
And How to generate...
asked 5 hours ago -
An explosion breaks a 20.0-kg object into three parts. The
object is initially moving at a...
asked 6 hours ago -
Calculate the approximate number of residues of Rubisco, which
is involved in carbon fixation in plants,...
asked 7 hours ago -
Other decisions about scientific claims can have a much broader
impact.ENERGYarrow-10x10.png, environment, health, security - all...
asked 8 hours ago -
I need to write a research paper and work cited about this
topic: The United States...
asked 8 hours ago -
Hello! I was wondering if I could have some help?
If the vapor pressure of carvone...
asked 8 hours ago -
An economist wants to estimate the mean per capita income (in
thousands of dollars) for a...
asked 9 hours ago -
What would be the input/output characteristic of a circuit
obtained by putting two of your 2's-complementers...
asked 9 hours ago -
In Drosophila, the transition from the syncytial blastoderm
stage to the cellular blastoderm stage is a...
asked 9 hours ago