This discussion introduces you to normal probability via the
calculated z-score. A z-score converts a non-standard normal
distribution into a standard normal distribution; a standard normal
distribution has a mean of zero and standard deviation of
one.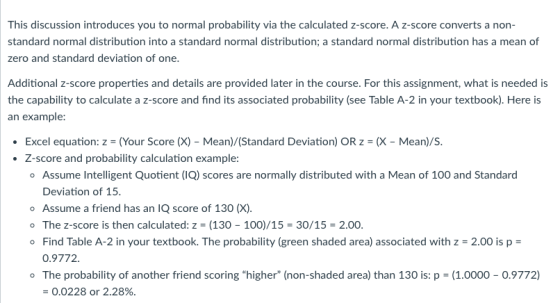


Homework Answers
since the data is not in soft form ( as it is image ) so only using the column KC-135, for the first cell value=2.36 , following calculation is done and question is answered after feeding data into ms-excel.
here n=number of observation and population standard deviation is calculated using all the observation n=16
for for value of 2.36, z=(2.36-3.7831)/2.8718=-0.4956
P(Z<-0.4956)=0.3101 ( you can also use ms-excel command =normsdist(-0.4956))
following information has been generated using
| Flight Name | KC-135 |
| Stories 1 | 2.36 |
| Stories 2 | 2.30 |
| Stories 3 | |
| Stories 4 | 2.45 |
| Stories 5 | 2.55 |
| Stories 6 | 3.00 |
| Stories 7 | 3.00 |
| Stories 8 | 3.00 |
| Stories 9 | 2.95 |
| Stories 10 | 2.70 |
| Stories 11 | 14.71 |
| Stories 12 | 3.00 |
| Stories 13 | 3.00 |
| Stories 14 | 3.81 |
| Stories 15 | 4.00 |
| Stories 16 | 4.00 |
| Stories 17 | 3.70 |
| n= | 16 |
| sum= | 60.5300 |
| mean= | 3.7831 |
| standard deviation= | 2.8718 |
| Z-score value= | -0.4956 |
| probability= | 0.3101 |
Add Answer to:
This discussion introduces you to normal probability via the
calculated z-score. A z-score converts a non-standard...
1) Given a standard normal distribution, find the probability of having a z score higher than...
1) Given a standard normal distribution, find the probability of having a z score higher than 1.67 ```{r} ``` 2) Given that test scores for a class are normally distributed with a mean of 80 and variance 36, find the probability that a test score is lower than a 45. ```{r} ``` 3) Given a standard normal distribution, find the Z score associated with a probability of .888 ```{r} ``` 4) Find the Z score associated with the 33rd quantile...
Find the indicated z score. The graph depicts the standard normal distribution with mean 0 and...
 Find the indicated z score. The graph depicts the standard normal distribution with mean 0 and standard deviation 1 C 0.2206 z 0 The indicated z score is (Round to two decimal places as needed.) Enter your answer in the answer box Find the indicated z score. The graph depicts the standard normal distribution with mean 0 and standard deviation 1. 0.7517 z 0 The indicated z score isa (Round to two decimal places as needed.) Enter vour answer in...
In a standard normal distribution, find the following values: The probability that a given z score...
In a standard normal distribution, find the following values: The probability that a given z score is less than -2.67 The probability that a given z score is between 1.55 and 2.44 The z scores that separates the most inner (middle) 82% of the distribution to the rest The z score that separate the lower 65 % to the rest of the distribution
the indicated z score. The graph depicts the standard normal distribution with mean 0 and standard...
 the indicated z score. The graph depicts the standard normal distribution with mean 0 and standard deviation 1. 02578, e indicated z score is ound to two decimal places as needed.)
find the indicated z score. the graph depicts the standard normal distrubution with mean 0 and...
 find the indicated z score. the graph depicts the standard normal
distrubution with mean 0 and standard deviation 1.
# on graph is: 0.9875
EQuestion Help Find the indicated z score. The graph depicts the standard nomal distribution with mean 0 and standard deviation 1 Click to view page1 of the table. Click to view page 2 of the lable The indicated z score isi (Round to two decimal places as needed)
find the indicated z score. the graph depicts the standard normal
distrubution with mean 0 and standard deviation 1.
# on graph is: 0.9875
EQuestion Help Find the indicated z score. The graph depicts the standard nomal distribution with mean 0 and standard deviation 1 Click to view page1 of the table. Click to view page 2 of the lable The indicated z score isi (Round to two decimal places as needed)
Find the indicated z,score. The graph depicts the standard normal distribution with mean 0 and standard...
 Find the indicated z,score. The graph depicts the standard normal distribution with mean 0 and standard deviation 1 0.1562 The indicated z score is □ (Round to two decimal places as needed.)
In a normal distribution, the mean corresponds to: Standard Score: z = Percentile: Which of the...
In a normal distribution, the mean corresponds to: Standard Score: z = Percentile: Which of the following statements are TRUE about the normal distribution? Check all that apply. A data value with z-score = -1.5 is located 1.5 standard deviations below the mean. The mean corresponds to the z-score of 1. The Empirical Rule only applies when a value is exactly 1, 2, or 3 standard deviations away from the mean. A z-score is the number of standard deviations a...
1. Assuming the Standard Normal Distribution, USING EXCEL find: a. What is the probability of...
1. Assuming the Standard Normal Distribution, USING EXCEL find: a. What is the probability of Z < than -1.75? b. What is the probability of Z > than 1.00? c. What is the probability of Z between 1.00 and 2.00? d. 15% of the cumulative probability is above what value for Z? e. 95% of the cumulative probability is below what value for Z? f. What is the probability of Z<-2.00 OR X> 2.00? ...
Find the indicated z score. The graph depicts the standard normal distribution with mean 0 and...
 Find the indicated z score. The graph depicts the standard normal distribution with mean 0 and standard deviation 1 0.2877 The indicated z score is (Round to two decimal places as needed.)
For a Standard Normal random variable Z, calculate the probability P(-0.25 < Z < 0.25). For...
For a Standard Normal random variable Z, calculate the probability P(-0.25 < Z < 0.25). For a Standard Normal random variable Z, calculate the probability P(-0.32 < Z < 0.32). For a Standard Normal random variable Z, calculate the probability P(-0.43 < Z < 0.43). Calculate the z-score of the specific value x = 26 of a Normal random variable X that has mean 20 and standard deviation 4. A Normal random variable X has mean 20 and standard deviation...
 Find the indicated z score. The graph depicts the standard normal distribution with mean 0 and standard deviation 1 C 0.2206 z 0 The indicated z score is (Round to two decimal places as needed.) Enter your answer in the answer box Find the indicated z score. The graph depicts the standard normal distribution with mean 0 and standard deviation 1. 0.7517 z 0 The indicated z score isa (Round to two decimal places as needed.) Enter vour answer in...
 the indicated z score. The graph depicts the standard normal distribution with mean 0 and standard deviation 1. 02578, e indicated z score is ound to two decimal places as needed.)
 find the indicated z score. the graph depicts the standard normal
distrubution with mean 0 and standard deviation 1.
# on graph is: 0.9875
EQuestion Help Find the indicated z score. The graph depicts the standard nomal distribution with mean 0 and standard deviation 1 Click to view page1 of the table. Click to view page 2 of the lable The indicated z score isi (Round to two decimal places as needed)
find the indicated z score. the graph depicts the standard normal
distrubution with mean 0 and standard deviation 1.
# on graph is: 0.9875
EQuestion Help Find the indicated z score. The graph depicts the standard nomal distribution with mean 0 and standard deviation 1 Click to view page1 of the table. Click to view page 2 of the lable The indicated z score isi (Round to two decimal places as needed)
 Find the indicated z,score. The graph depicts the standard normal distribution with mean 0 and standard deviation 1 0.1562 The indicated z score is □ (Round to two decimal places as needed.)
 Find the indicated z score. The graph depicts the standard normal distribution with mean 0 and standard deviation 1 0.2877 The indicated z score is (Round to two decimal places as needed.)
Most questions answered within 3 hours.
-
The mean waiting time at the drive-through of a fast-food
restaurant from the time an order...
asked 9 minutes ago -
The pitch (p) of a helix is defined as p = dn, in which n is...
asked 11 minutes ago -
Do you agree that the declining stock of social capital is the
blame for the failure...
asked 15 minutes ago -
A researcher is interested in whether coffee consumption helps
with performance on reading comprehension tasks. The...
asked 25 minutes ago -
it has been estimated since the beginning of the human race that
about 133 metric ton...
asked 30 minutes ago -
Where must Medicare prescription drug plans allow for
participants to fill their prescriptions?
asked 33 minutes ago -
Five moles of monatomic ideal gas have initial pressure 2.50 ×
103 Pa and initial volume...
asked 48 minutes ago -
A resistor and the capacitor are used to control the timing in
the RC circuit of...
asked 48 minutes ago -
Living in a group could bring several disadvantages to an
individual. What are some of the...
asked 1 hour ago -
Complete and balance the following reactions. In case of no
reaction occurring write NR.
Mix #1:...
asked 1 hour ago -
If an economy consumes 75% of any increase in income, then an
increase in autonomous investment...
asked 1 hour ago -
A shotputter throws the shot with an initial speed of 15.8 m/s
at a 38.0 ∘...
asked 1 hour ago