
 Please show all of the
work. Thank you:)
Please show all of the
work. Thank you:)
Homework Answers
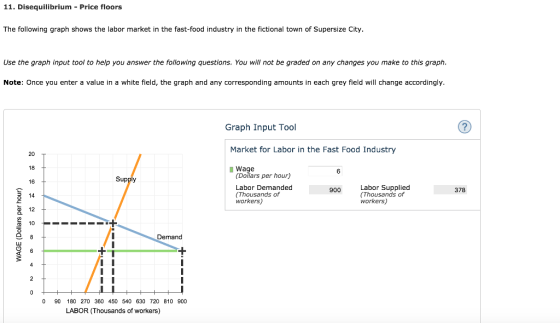
Equilibrium is attained at the intersection of the demand and
supply curves respectively.
Labor demand curve and the labor supply curve is intersecting each other corresponding to the wage rate of $10 per hour and the labor of 450,000 workers.
So,
In this market, the equilibrium hourly wage is $10, and the equilibrium quantity of labor is 450 thousand workers.
When minimum price of a commodity or service is fixed then such price control is referred to as price floor.
So,
Suppose a senator introduces a bill to legislate a minimum hourly wage of $6. This type of price control is called a Price Floor.
When labor demand is greater than the labor supply then there is upward pressure on the wage rate.
On the other hand, when labor demand is less than the labor supply, there is downward pressure on the wage rate.
Following is the complete table -

Minimum wage can only be binding when it is fixed at a level greater than the equilibrium wage.
In this market, the equilibrium wage rate is $10 per hour.
So,
A minimum wage below $10 per hour is not a binding minimum wage in this market.
Hence, the given statement is True.
Add Answer to:
Please show all of the
work. Thank you:)
11. Disequilibrium - Price floors The following graph...
The following graph shows the labor market in the fast-food industry in the fictional town of...
 The following graph shows the labor market in the fast-food industry in the fictional town of Supersize City. Use the graph input tool to help you answer the following questions. You will not be graded on any changes you make to this graph. Note: Once you enter a value in a white field, the graph and any corresponding amounts in each grey field will change accordingly. Graph Input Tool Market for Labor in the Fast Food Industry Supply Wage (Dollars...
4. Minimum wage legislation The following graph shows the labor market in the fast-food industry in...
 4. Minimum wage legislation The following graph shows the labor market in the fast-food industry in the fictional town of Supersize City. Use the graph input tool to help you answer the following questions. You will not be graded on any changes you make to this graph. Note: Once you enter a value in a white field, the graph and any corresponding amounts in each grey field will change accordingly. In this market, the equilibrium hourly wage is and the equilibrium quantity of laboris...
The following graph shows the labor market in the fast-food industry in the fictional town of...
 The following graph shows the labor market in the fast-food industry in the fictional town of Supersize City Use the graph input tool to help you answer the following questions. You will not be graded on any changes you make to this graph Note: Once you enter a value in a white field, the graph and any corresponding amounts in each grey field will change accordingly. Graph Input Tool Market for Labor in the Fast Food Industry & Wage (Dollars...
I need help filling this out. Thank you! Homework (Ch 06) 4. Minimum wage legislation The...
 I need help filling this out. Thank you!
Homework (Ch 06) 4. Minimum wage legislation The following graph shows the labor market in the fast-food industry in the fictional town of Supersize City. Use the graph input tool to help you answer the following questions. You will not be graded on any changes you make to this graph. Note: Once you enter a value in a white field, the graph and any corresponding amounts in each grey field will change...
I need help filling this out. Thank you!
Homework (Ch 06) 4. Minimum wage legislation The following graph shows the labor market in the fast-food industry in the fictional town of Supersize City. Use the graph input tool to help you answer the following questions. You will not be graded on any changes you make to this graph. Note: Once you enter a value in a white field, the graph and any corresponding amounts in each grey field will change...
The following graph shows the labor market in the fast-food industry in the fictional town of...
 The following graph shows the labor market in the fast-food industry in the fictional town of Supersize City. Use the graph input tool to help you answer the following questions. You will not be graded on any changes you make to this graph. Note: Once you enter a value in a white field, the graph and any corresponding amounts in each grey field will change accordingly. Graph Input Tool Market for Labor in the Fast Food Industry Wage (Dollars per...
The following graph shows the labor market in the fast-food Industry in the fictional town of...
 The following graph shows the labor market in the fast-food Industry in the fictional town of Supersize City. Use the graph input tool to help you answer the following questions. You will not be graded on any changes you make to this graph. Note: Once you enter a value in a white field, the graph and any corresponding amounts in each grey held will change accordingly. Graph Input Tool Market for Labor in the Fast Food Industry Wage (Dollars per...
The following graph shows the labor market in the fast-foodindustry in the fictional town of...
 The following graph shows the labor market in the fast-food
industry in the fictional town of Supersize City.Use the graph input tool to help you answer the following
questions. You will not be graded on any changes you make to this
graph.Note: Once you enter a value in a white field, the graph and any
corresponding amounts in each grey field will change
accordingly.In this market, the equilibrium hourly wage is___, and the
equilibrium quantity of labor is___ thousand workers.Suppose...
The following graph shows the labor market in the fast-food
industry in the fictional town of Supersize City.Use the graph input tool to help you answer the following
questions. You will not be graded on any changes you make to this
graph.Note: Once you enter a value in a white field, the graph and any
corresponding amounts in each grey field will change
accordingly.In this market, the equilibrium hourly wage is___, and the
equilibrium quantity of labor is___ thousand workers.Suppose...
4. Minimum wage legislation The following graph shows the labor market in the fast-food industry in...
 4. Minimum wage legislation The following graph shows the labor market in the fast-food industry in the fictional town of Supersize City. Use the graph input tool to help you answer the following questions. You will not be graded on any changes you make to this graph. Note: Once you enter a value in a white field, the graph and any corresponding amounts in each grey field will change accordingly. Graph Input Tool Market for Labor in the Fast Food...
The following graph shows the labor market in the fast-food industry in the fictional town of...
 The following graph shows the labor market in the fast-food industry in the fictional town of Supersize City. Use the graph input tool to help you answer the following questions. You will not be graded on any changes you make to this graph Note: Once you enter a value in a white field, the graph and any corresponding amounts in each grey field will change accordingly Graph Input Tool Market for Labor in the Fast Food Industry 20 T 18...
 The following graph shows the labor market in the fast-food industry in the fictional town of Supersize City. Use the graph input tool to help you answer the following questions. You will not be graded on any changes you make to this graph. Note: Once you enter a value in a white field, the graph and any corresponding amounts in each grey field will change accordingly. Graph Input Tool Market for Labor in the Fast Food Industry Supply Wage (Dollars...
 The following graph shows the labor market in the fast-food industry in the fictional town of Supersize City Use the graph input tool to help you answer the following questions. You will not be graded on any changes you make to this graph Note: Once you enter a value in a white field, the graph and any corresponding amounts in each grey field will change accordingly. Graph Input Tool Market for Labor in the Fast Food Industry & Wage (Dollars...
 I need help filling this out. Thank you!
Homework (Ch 06) 4. Minimum wage legislation The following graph shows the labor market in the fast-food industry in the fictional town of Supersize City. Use the graph input tool to help you answer the following questions. You will not be graded on any changes you make to this graph. Note: Once you enter a value in a white field, the graph and any corresponding amounts in each grey field will change...
I need help filling this out. Thank you!
Homework (Ch 06) 4. Minimum wage legislation The following graph shows the labor market in the fast-food industry in the fictional town of Supersize City. Use the graph input tool to help you answer the following questions. You will not be graded on any changes you make to this graph. Note: Once you enter a value in a white field, the graph and any corresponding amounts in each grey field will change...
 The following graph shows the labor market in the fast-food industry in the fictional town of Supersize City. Use the graph input tool to help you answer the following questions. You will not be graded on any changes you make to this graph. Note: Once you enter a value in a white field, the graph and any corresponding amounts in each grey field will change accordingly. Graph Input Tool Market for Labor in the Fast Food Industry Wage (Dollars per...
 The following graph shows the labor market in the fast-food Industry in the fictional town of Supersize City. Use the graph input tool to help you answer the following questions. You will not be graded on any changes you make to this graph. Note: Once you enter a value in a white field, the graph and any corresponding amounts in each grey held will change accordingly. Graph Input Tool Market for Labor in the Fast Food Industry Wage (Dollars per...
 The following graph shows the labor market in the fast-food
industry in the fictional town of Supersize City.Use the graph input tool to help you answer the following
questions. You will not be graded on any changes you make to this
graph.Note: Once you enter a value in a white field, the graph and any
corresponding amounts in each grey field will change
accordingly.In this market, the equilibrium hourly wage is___, and the
equilibrium quantity of labor is___ thousand workers.Suppose...
The following graph shows the labor market in the fast-food
industry in the fictional town of Supersize City.Use the graph input tool to help you answer the following
questions. You will not be graded on any changes you make to this
graph.Note: Once you enter a value in a white field, the graph and any
corresponding amounts in each grey field will change
accordingly.In this market, the equilibrium hourly wage is___, and the
equilibrium quantity of labor is___ thousand workers.Suppose...
 4. Minimum wage legislation The following graph shows the labor market in the fast-food industry in the fictional town of Supersize City. Use the graph input tool to help you answer the following questions. You will not be graded on any changes you make to this graph. Note: Once you enter a value in a white field, the graph and any corresponding amounts in each grey field will change accordingly. Graph Input Tool Market for Labor in the Fast Food...
 4. Minimum wage legislation The following graph shows the labor market in the fast-food industry in the fictional town of Supersize City. Use the graph input tool to help you answer the following questions. You will not be graded on any changes you make to this graph. Note: Once you enter a value in a white field, the graph and any corresponding amounts in each grey field will change accordingly. Graph Input Tool Market for Labor in the Fast Food...
 The following graph shows the labor market in the fast-food industry in the fictional town of Supersize City. Use the graph input tool to help you answer the following questions. You will not be graded on any changes you make to this graph Note: Once you enter a value in a white field, the graph and any corresponding amounts in each grey field will change accordingly Graph Input Tool Market for Labor in the Fast Food Industry 20 T 18...
Most questions answered within 3 hours.
-
The factory method and the abstract factory pattern use
different object oriented
mechanisms are used to...
asked 50 minutes ago -
Given the data below for the monthly sales data at each branch in
your region for...
asked 1 hour ago -
Blossom Company owns 10000 of the 50000 outstanding shares of
Taylor, Inc. common stock. During 2018,...
asked 2 hours ago -
Calculate the following: ***SHOW ALL WORK!!!! Or
NO CREDIT*** Circle your answers. 8pts
each
In the...
asked 4 hours ago -
Bank Z is currently advertising interest rates on its checking
account. They claim to pay an...
asked 4 hours ago -
List two ways of transformation on the response variable that
can be used to deal with...
asked 5 hours ago -
If a 2000 ohm resistor has a -3.90 mA current going through it.
What is the...
asked 5 hours ago -
Please comment on the sentences.
Some types of jobs require more training than others. Some
companies...
asked 6 hours ago -
The )G01 for the hydrolysis of phosphorarginine
reaction depicted below is –32 kJ mol-1.
Phosphoarginine ...
asked 6 hours ago -
Cross a heterozygous blue-eyed goat with a homozygous brown-eyed
goat. Be sure to indicate which kids...
asked 7 hours ago -
Use the following information to answer the next two
questions.
Please refer to question 9-90. A...
asked 7 hours ago -
A solution containing 0.050 g of an unknown electrolyte in 2.50
g of cyclohexane was found...
asked 7 hours ago