

Homework Answers
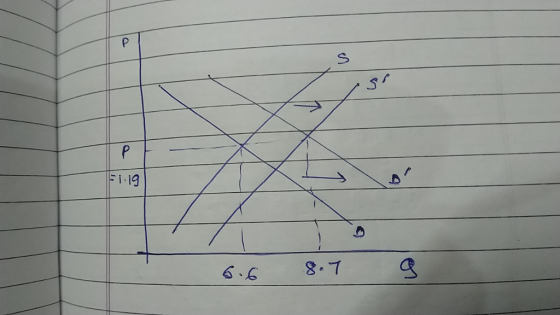
The reason behind this is that the magnitude of shift in the demand and supply of gasoline is equal,which has resulted in only a rise in quantity and not price.
Add Answer to:
In March 2002 the retail price of gasoline was $1.19 per gallon-exactly the same as it...
8. In March 2002 the retail price of gasoline was S1.19 per gallon-exactly the same as...
 8. In March 2002 the retail price of gasoline was S1.19 per gallon-exactly the same as it was in August 1990. Yet total gasoline production and consumption rose from 6.6 million gallons per week in 1990 to 8.7 million gallons per week in 2002. Using the graph below, draw the appropriate shifts in the demand and supply curves to explain these two phenomena Price (S/gallon) S1990 D1990 Millions of gallons/week
The Energy Information Administration reported that the mean retail price per gallon of regular grade gasoline...
The Energy Information Administration reported that the mean retail price per gallon of regular grade gasoline was $3.51 . Suppose that the standard deviation was $0.10 and that the retail price per gallon has a bell-shaped distribution. (Hint: You must use the empirical rule for this problem. ) a. What percentage of regular grade gasoline sold between $3.31 and $3.71 per gallon (to 1 decimal)? b. What percentage of regular grade gasoline sold between $3.31 and $3.61 per gallon (to...
The Energy Information Administration reported that the mean retail price per gallon of regular grade gasoline...
The Energy Information Administration reported that the mean retail price per gallon of regular grade gasoline was $3.60 . Suppose that the standard deviation was $0.10 and that the retail price per gallon has a bell-shaped distribution. NOTE: Please use empirical rule approximations for this problem. a. What percentage of regular grade gasoline sold between $3.50 and $3.70 per gallon (to 1 decimal)? b. What percentage of regular grade gasoline sold between $3.50 and $3.80 per gallon (to 1 decimal)?...
D . The avera ge price per gallon of regular gasoline was reported to be $22.34...
D . The avera ge price per gallon of regular gasoline was reported to be $22.34 in Ohio . Use this price as the population m ean,, and assume that the popula tion standard deviation is $00.16 . 7 . For a random sample of 64 service stations,, find the standard deviation of the sampling distribution of the sample mean (uuse exactly two de c imal places)) . 8 . What is the probability that the mean price for a...
 8. In March 2002 the retail price of gasoline was S1.19 per gallon-exactly the same as it was in August 1990. Yet total gasoline production and consumption rose from 6.6 million gallons per week in 1990 to 8.7 million gallons per week in 2002. Using the graph below, draw the appropriate shifts in the demand and supply curves to explain these two phenomena Price (S/gallon) S1990 D1990 Millions of gallons/week
Most questions answered within 3 hours.
-
For the data set shown below, complete parts (a) through (d)
below. x 3 4 5...
asked 1 minute from now -
A university administrator working in student housing wants to
determine if the percentage of students residing...
asked 12 minutes ago -
3). Describe human population growth that has occurred in the
past 400 years. Use terms learned...
asked 9 minutes ago -
A
projectile is blue at a target. The distance from the point of
impact to the...
asked 33 minutes ago -
Given a 32 bit processor, with 2 MB of physical RAM split into 512
frames. What...
asked 24 minutes ago -
What were the main rulings in the Supreme Court cases which are
Morgan v. Virginia (1946)...
asked 23 minutes ago -
write a five paragraph essay on how setting,
specifically culture, influences the actions of
the characters...
asked 15 minutes ago -
JAVA
Provide a simple code sample of Merge sort
asked 25 minutes ago -
Discounting cash flows involves:
A. taking the cash discount offered on a trade merchandise
B. estimating...
asked 33 minutes ago -
A solid wood door 1.00 m wide and 2.00 m high is hinged along
one side...
asked 33 minutes ago -
Raleigh Company manufactures two joint products. At the
split-off point, they have sales values of:
Product...
asked 32 minutes ago -
1. Your grandmother has invested $4000 in a mutual fund each
year on your birthday (she...
asked 34 minutes ago