On a labor-leisure diagram, illustrate the impact on desired hours of work resulting from an increase...
On a labor-leisure diagram, illustrate the impact on desired hours of work resulting from an increase in non-wage income. Assume leisure is a normal good.
Homework Answers
The labour leisure diagram shows workers preference and trade off between leisure and labour given the hours of work , non labour income etc. Here we are assuming that leisure is a normal good. When a good is normal , it implies that the quantity demanded of the good tends to increase as the income increases. In common terms also , if we have more income or wealth , then it implies that normally we would want to work less. The same thing is depicted in the diagram.
The diagram below shows the indifference curves and budget lines. The indifference curves are downward sloping , convex and do not interesect (which are the basic characteristics of the indifference curves )
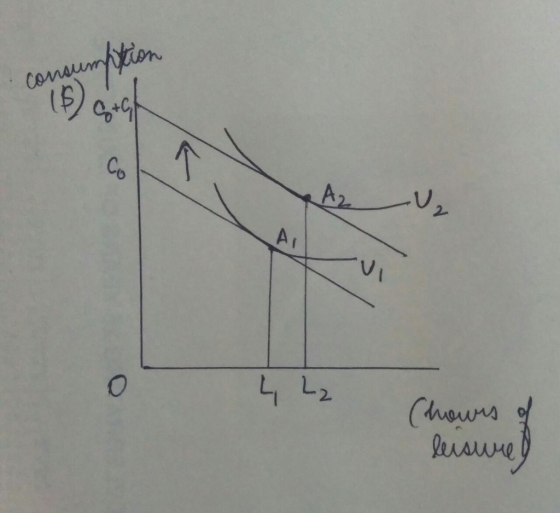
When the nonwage income increases ie the income increased due to sources other than work from which we derive , leisure being a normal good. it implies that due to the pure income effect the consumer would now consume all of the goods at a higher quantity and would reduce hours of work or increase hours of leisure.
So individual has a parallel shift in budget line and shifts to point A2 which is on a higher indifference curve ie U2. He is better off at U2 than U1. Also the leisure hours shift from L1 to L2 (increases )
On the level of consumption, consumption has increased from C0 to C0+C1 where C1 is the increase due to non labour increase in income.
So assuming leisure to be a normal good , the increase in non labour income would reduce working hours , increase leisure hours and the consumption of othe goods of the individual.
(You can comment for doubts )
Add Answer to:
On a labor-leisure diagram, illustrate the impact on desired
hours of work resulting from an increase...
3. Show on work-leisure diagram a low wage worker working 8 hours per day. Assume the...
 3. Show on work-leisure diagram a low wage worker working 8 hours per day. Assume the government wants to help this worker by giving them a $300 grant to help with their weekly expenses. Show the labor supply impact this would have on the workers. Instead, show the impact on this worker if the government added an extra dollar amount for every additional hour the person worked.
Labor Economics 1. In the leisure-income model, the wage constraint shows a. the points that maximize...
 Labor Economics
1. In the leisure-income model, the wage constraint shows a. the points that maximize a worker's utility b. all points that are equally preferred c. the wage rates that affect work decisions d. the available combinations of leisure and income 2. The slope of a wage constraint reflects the: a. rate at which a person is willing to substitute leisure for income c. income effect b. price of leisure d. substitution effect 3. When a worker maximizes her...
Labor Economics
1. In the leisure-income model, the wage constraint shows a. the points that maximize a worker's utility b. all points that are equally preferred c. the wage rates that affect work decisions d. the available combinations of leisure and income 2. The slope of a wage constraint reflects the: a. rate at which a person is willing to substitute leisure for income c. income effect b. price of leisure d. substitution effect 3. When a worker maximizes her...
Labor Economics, multiple choice questions 1. In the leisure-income model, the wage constraint shows a. the...
 Labor Economics, multiple choice questions
1. In the leisure-income model, the wage constraint shows a. the points that maximize a worker's utility b. all points that are equally preferred c. the wage rates that affect work decisions d. the available combinations of leisure and income 2. The slope of a wage constraint reflects the: a. rate at which a person is willing to substitute leisure for income c. income effect b. price of leisure d. substitution effect 3. When a...
Labor Economics, multiple choice questions
1. In the leisure-income model, the wage constraint shows a. the points that maximize a worker's utility b. all points that are equally preferred c. the wage rates that affect work decisions d. the available combinations of leisure and income 2. The slope of a wage constraint reflects the: a. rate at which a person is willing to substitute leisure for income c. income effect b. price of leisure d. substitution effect 3. When a...
On a separate sheet of paper, draw a labor-leisure diagram with consumption ($) on the vertical...
On a separate sheet of paper, draw a labor-leisure diagram with consumption ($) on the vertical axis, and hours of leisure on the horizontal axis. Assume there are 16 discretionary hours in a day, and that wage is $20 per hour, and unearned income, V, is $100. Draw the budget constraint for a day, labeling the endpoints, and draw a utility maximizing indifference curve. Label approximate hours of leisure, labor, and earnings at the optimal point (choose numbers that appear...
Exercise 4. Labor Supply with non-labor income (Cobb-Douglas) Each day you are endowed with 24 hours...
 Exercise 4. Labor Supply with non-labor income (Cobb-Douglas) Each day you are endowed with 24 hours (T=24) that you can spend either in leisure (l) or working (L). For hour of labor you receive an hourly wage, w, but you also have non-labor income, m. Your consumption, c, is constrained by your labor and non-labor income: c= m +wL. You value consumption and leisure according to the following utility: u =cl2. a) What is your labor supply, as a function...
Problem 3 Alan's utility function for consumption (C) and leisure time (1) is U(C,1) = 2C1/2...
 Problem 3 Alan's utility function for consumption (C) and leisure time (1) is U(C,1) = 2C1/2 + 1. Each week, Alan has a time endowment of 120 hours that he can devote to work (N) or leisure time (7). The unit price of C is $1 while the unit wage rate is w. Alan also earns A dollars per week of non-labor income. a) Write the expression of Alan's budget constraint. b) Find Alan's optimal combination of consumption and leisure...
6. On a standard income-leisure diagram, Tony has flatter indifference curves than Bruce, but both are...
6. On a standard income-leisure diagram, Tony has flatter indifference curves than Bruce, but both are negatively sloped. It is probably true that: a. Both like leisure and income, but Bruce values leisure relatively more than Tony does. b. Bruce likes leisure but dislikes income while Tony likes both c. Bruce likes income but dislikes leisure while Tony likes both d. Tony values leisure more highly compared to income than Bruce does 7. As an individual’s wage rate gets higher,...
Suppose you have 24 hours per day that you can allocate between leisure and working (i)...
Suppose you have 24 hours per day that you can allocate between leisure and working (i) Draw the budget constraint between “leisure hours” on the horizontal axis and “wage income” on the vertical when the wage rate is $40 per hour. Mark an optimum point A that is meaningful. Draw a new budget constraint when the wage rate falls to $30 per hour. Show a new optimum point B. (ii) On your indifference curve diagram, decompose the effect of the...
Two individuals, Sam and Barb, derive utility from the hours of leisure (L) they consume and...
 Two individuals, Sam and Barb, derive utility from the hours of leisure (L) they consume and from the amount of goods (G) they consume. In order to maximize utility, they need to allocate the 24 hours in the day between leisure hours and work hours. The price of a good is equal to $1.00 and the price of leisure is equal to the hourly wage. We observe the following information about the choices that the two individuals make: O O...
 3. Show on work-leisure diagram a low wage worker working 8 hours per day. Assume the government wants to help this worker by giving them a $300 grant to help with their weekly expenses. Show the labor supply impact this would have on the workers. Instead, show the impact on this worker if the government added an extra dollar amount for every additional hour the person worked.
 Labor Economics
1. In the leisure-income model, the wage constraint shows a. the points that maximize a worker's utility b. all points that are equally preferred c. the wage rates that affect work decisions d. the available combinations of leisure and income 2. The slope of a wage constraint reflects the: a. rate at which a person is willing to substitute leisure for income c. income effect b. price of leisure d. substitution effect 3. When a worker maximizes her...
Labor Economics
1. In the leisure-income model, the wage constraint shows a. the points that maximize a worker's utility b. all points that are equally preferred c. the wage rates that affect work decisions d. the available combinations of leisure and income 2. The slope of a wage constraint reflects the: a. rate at which a person is willing to substitute leisure for income c. income effect b. price of leisure d. substitution effect 3. When a worker maximizes her...
 Labor Economics, multiple choice questions
1. In the leisure-income model, the wage constraint shows a. the points that maximize a worker's utility b. all points that are equally preferred c. the wage rates that affect work decisions d. the available combinations of leisure and income 2. The slope of a wage constraint reflects the: a. rate at which a person is willing to substitute leisure for income c. income effect b. price of leisure d. substitution effect 3. When a...
Labor Economics, multiple choice questions
1. In the leisure-income model, the wage constraint shows a. the points that maximize a worker's utility b. all points that are equally preferred c. the wage rates that affect work decisions d. the available combinations of leisure and income 2. The slope of a wage constraint reflects the: a. rate at which a person is willing to substitute leisure for income c. income effect b. price of leisure d. substitution effect 3. When a...
 Exercise 4. Labor Supply with non-labor income (Cobb-Douglas) Each day you are endowed with 24 hours (T=24) that you can spend either in leisure (l) or working (L). For hour of labor you receive an hourly wage, w, but you also have non-labor income, m. Your consumption, c, is constrained by your labor and non-labor income: c= m +wL. You value consumption and leisure according to the following utility: u =cl2. a) What is your labor supply, as a function...
 Problem 3 Alan's utility function for consumption (C) and leisure time (1) is U(C,1) = 2C1/2 + 1. Each week, Alan has a time endowment of 120 hours that he can devote to work (N) or leisure time (7). The unit price of C is $1 while the unit wage rate is w. Alan also earns A dollars per week of non-labor income. a) Write the expression of Alan's budget constraint. b) Find Alan's optimal combination of consumption and leisure...
 Problem 3 Alan's utility function for consumption (C) and leisure time (1) is U(C,1) = 2C1/2 + 1. Each week, Alan has a time endowment of 120 hours that he can devote to work (N) or leisure time (7). The unit price of C is $1 while the unit wage rate is w. Alan also earns A dollars per week of non-labor income. a) Write the expression of Alan's budget constraint. b) Find Alan's optimal combination of consumption and leisure...
 Two individuals, Sam and Barb, derive utility from the hours of leisure (L) they consume and from the amount of goods (G) they consume. In order to maximize utility, they need to allocate the 24 hours in the day between leisure hours and work hours. The price of a good is equal to $1.00 and the price of leisure is equal to the hourly wage. We observe the following information about the choices that the two individuals make: O O...
Most questions answered within 3 hours.
-
Calculate the pH of each of the following solutions.
0.50 M HBr
3.1×10⁻⁴ M KOH
4.2×10⁻⁵...
asked 49 minutes ago -
For the year ended December 31, Depot Max’s cost of merchandise
sold was $85,600. Inventory at the...
asked 48 minutes ago -
Week 10 - Professional Memo Assignment
Professional Memo Assignment
Your mission for this week, should you...
asked 53 minutes ago -
Write a Python program that stores the data for each
player on the team, and it...
asked 1 hour ago -
In
the last 3 months, mike never knows when he is going to get his
allowance...
asked 1 hour ago -
Is Ca(OH)2 a Bronsted base, Lewis base, or both? Why?
asked 1 hour ago -
1A- Why don’t voters complain about U.S. tariffs on imported
sugar?
Because sugar is only a...
asked 1 hour ago -
Cash Payback Period
Primera Banco is evaluating two capital investment proposals for
a drive-up ATM kiosk,...
asked 1 hour ago -
Create a button in Swift (Xcode) that will create a charge,
create a charge using Stripe's...
asked 1 hour ago -
The reaction rate of CO and NO2 in the reaction
CO(g) + NO2(g) → CO2(g) +...
asked 1 hour ago -
Imagine that a chemist puts 6.40 mol each of
C3H8 and O2 in a 1.00-L container...
asked 1 hour ago -
How much money should be invested today in order to have $8340
at the end of...
asked 1 hour ago