


Homework Answers


Add Answer to:
Instructions The comparative balance sheet of Livers Inc. for December 31, 20Y3 and 20Y2, is shown...
The comparative balance sheet of Livers Inc. for December 31, 20Y3 and 20Y2, is as follows:...
 The comparative balance sheet of Livers Inc. for December 31, 20Y3 and 20Y2, is as follows: Dec. 31, 20Y2 Dec. 31, 20Y3 Assets 2 $625,650.00 $586,340.00 3 Cash Accounts receivable (net) 208,030.00 228,170.00 4 5 Inventories 641,480.00 617,130.00 0.00 240,290.00 6 Investments 7 Land 328,170.00 0.00 8 Equipment 552,300.00 706,070.00 (147,010.00) 9 Accumulated depreciation-equipment (165,580.00) $2,363,960.00 $2,057,080.00 10 Total assets Liabilities and Stockholders' Equity 11 1. $424,300.00 $404,860.00 12 Accounts payable (merchandise creditors) 13 Accrued expenses payable (operating expenses) 41,850.00...
he comparative balance sheet of Livers Inc. for December 31, 20Y3 and 20Y2, is shown as...
he comparative balance sheet of Livers Inc. for December 31, 20Y3 and 20Y2, is shown as follows: Dec. 31, 20Y3 Dec. 31, 20Y2 Assets Cash $270,970 $250,900 Accounts receivable (net) 98,160 90,110 Inventories 277,110 266,820 Investments 0 103,360 Land 142,130 0 Equipment 305,730 235,880 Accumulated depreciation—equipment (71,580) (63,610) Total assets $1,022,520 $883,460 Liabilities and Stockholders' Equity Accounts payable (merchandise creditors) $185,080 $174,040 Accrued expenses payable (operating expenses) 18,410 22,970 Dividends payable 10,230 7,950 Common stock, $10 par 55,220 43,290 Paid-in...
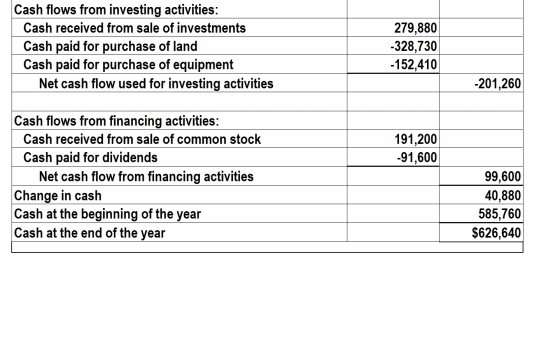
The comparative balance sheet of Navaria Inc. for December 31, 20Y3 and 20Y2, is shown as...
The comparative balance sheet of Navaria Inc. for December 31, 20Y3 and 20Y2, is shown as follows: 1 Dec. 31, 20Y3 Dec. 31, 20Y2 2 Assets 3 Cash $626,640.00 $585,760.00 4 Accounts receivable (net) 226,900.00 208,390.00 5 Inventories 641,350.00 616,130.00 6 Investments 0.00 239,300.00 7 Land 328,730.00 0.00 8 Equipment 705,940.00 553,530.00 9 Accumulated depreciation-equipment (166,970.00) (148,000.00) 10 Total assets $2,362,590.00 $2,055,110.00 11 Liabilities and Stockholders’ Equity 12 Accounts payable $425,140.00 $404,540.00 13 Accrued expenses payable 42,020.00 52,750.00 14 Dividends...
Statement of Cash Flows—Indirect Method The comparative balance sheet of Livers Inc. for December 31, 20Y3...
Statement of Cash Flows—Indirect Method The comparative balance sheet of Livers Inc. for December 31, 20Y3 and 20Y2, is shown as follows: Dec. 31, 20Y3 Dec. 31, 20Y2 Assets Cash $253,630 $237,840 Accounts receivable (net) 91,880 85,420 Inventories 259,370 252,910 Investments 0 97,980 Land 133,030 0 Equipment 286,170 223,600 Accumulated depreciation—equipment (67,000) (60,300) Total assets $957,080 $837,450 Liabilities and Stockholders' Equity Accounts payable (merchandise creditors) $173,230 $164,980 Accrued expenses payable (operating expenses) 17,230 21,770 Dividends payable 9,570 7,540 Common stock,...
The comparative balance sheet of Livers Inc. for December 31, 20Y3 and 20Y2, is as follows:...
The comparative balance sheet of Livers Inc. for December 31, 20Y3 and 20Y2, is as follows: 1 Dec. 31, 20Y3 Dec. 31, 20Y2 2 Assets 3 Cash $625,650.00 $586,340.00 4 Accounts receivable (net) 228,170.00 208,030.00 5 Inventories 641,480.00 617,130.00 6 Investments 0.00 240,290.00 7 Land 328,170.00 0.00 8 Equipment 706,070.00 552,300.00 9 Accumulated depreciation-equipment (165,580.00) (147,010.00) 10 Total assets $2,363,960.00 $2,057,080.00 11 Liabilities and Stockholders’ Equity 12 Accounts payable (merchandise creditors) $424,300.00 $404,860.00 13 Accrued expenses payable (operating expenses) 41,850.00...
Statement of Cash Flows—Indirect Method The comparative balance sheet of Livers Inc. for December 31, 20Y3 and 20Y2, is...
Statement of Cash Flows—Indirect Method The comparative balance sheet of Livers Inc. for December 31, 20Y3 and 20Y2, is shown as follows: Dec. 31, 20Y3 Dec. 31, 20Y2 Assets Cash $244,600 $230,160 Accounts receivable (net) 88,610 82,660 Inventories 250,140 244,740 Investments 0 94,820 Land 128,300 0 Equipment 275,980 216,380 Accumulated depreciation—equipment (64,610) (58,350) Total assets $923,020 $810,410 Liabilities and Stockholders' Equity Accounts payable (merchandise creditors) $167,070 $159,650 Accrued expenses payable (operating expenses) 16,610 21,070 Dividends payable 9,230 7,290 Common stock,...
Statement of Cash Flows—Indirect Method The comparative balance sheet of Livers Inc. for December 31, 20Y3...
Statement of Cash Flows—Indirect Method The comparative balance sheet of Livers Inc. for December 31, 20Y3 and 20Y2, is shown as follows: Dec. 31, 20Y3 Dec. 31, 20Y2 Assets Cash $261,120 $243,460 Accounts receivable (net) 94,590 87,440 Inventories 267,040 258,890 Investments 0 100,300 Land 136,970 0 Equipment 294,620 228,890 Accumulated depreciation—equipment (68,980) (61,720) Total assets $985,360 $857,260 Liabilities and Stockholders' Equity Accounts payable (merchandise creditors) $178,350 $168,880 Accrued expenses payable (operating expenses) 17,740 22,290 Dividends payable 9,850 7,720 Common stock,...
Instructions The comparative balance sheet of Livers Inc. for December 31, 20Y3 and 20Y2, is shown...
 Instructions The comparative balance sheet of Livers Inc. for December 31, 20Y3 and 20Y2, is shown as follows: Dec 31, 2093 Dec 31, 2092 Assets Cash $585.190.00 $626,100.00 228,630.00 Accounts receivable (net) 208.060.00 Inventories 641,030.00 617,620.00 Investments 0.00 239.850.00 Land 0.00 528.160.00 705.110.00 Equipment 1166.940.00) Accumulated depreciation-equipment Total assets Liabilities and Stockholders' Equity 553.850.00 (147,700.00) 52.056.850.00 $2.382.190.00 Check My Work Assignment Score: 49.13% TEZOVUZLUUMUUUU $423,690.00 case Labilities and Stockholders' Equity 12 Accounts payable (merchandise creditors) 13 Accrued expenses payable (operating...
Statement of Cash Flows-Indirect Method The comparative balance sheet of Livers Inc. for December 31, 2013...
 Statement of Cash Flows-Indirect Method The comparative balance sheet of Livers Inc. for December 31, 2013 and 20Y2, is shown as follows: Dec. 31, 20Y3 Dec. 31, 2012 Assets Cash Accounts receivable (net) $251,660 91,170 257,350 $235,180 84,470 250,070 96,890 Inventories Investments 0 Land 221,100 Equipment Accumulated depreciation equipment 132,000 283,950 (66,480) $949,650 (59,620) $828,090 Total assets Liabilities and Stockholders' Equity Accounts payable (merchandise creditors) Accrued expenses payable (operating expenses) $171,890 17,090 9,500 $163,130 21,530 7,450 40,580 Dividends payable Common...
 The comparative balance sheet of Livers Inc. for December 31, 20Y3 and 20Y2, is as follows: Dec. 31, 20Y2 Dec. 31, 20Y3 Assets 2 $625,650.00 $586,340.00 3 Cash Accounts receivable (net) 208,030.00 228,170.00 4 5 Inventories 641,480.00 617,130.00 0.00 240,290.00 6 Investments 7 Land 328,170.00 0.00 8 Equipment 552,300.00 706,070.00 (147,010.00) 9 Accumulated depreciation-equipment (165,580.00) $2,363,960.00 $2,057,080.00 10 Total assets Liabilities and Stockholders' Equity 11 1. $424,300.00 $404,860.00 12 Accounts payable (merchandise creditors) 13 Accrued expenses payable (operating expenses) 41,850.00...
 Instructions The comparative balance sheet of Livers Inc. for December 31, 20Y3 and 20Y2, is shown as follows: Dec 31, 2093 Dec 31, 2092 Assets Cash $585.190.00 $626,100.00 228,630.00 Accounts receivable (net) 208.060.00 Inventories 641,030.00 617,620.00 Investments 0.00 239.850.00 Land 0.00 528.160.00 705.110.00 Equipment 1166.940.00) Accumulated depreciation-equipment Total assets Liabilities and Stockholders' Equity 553.850.00 (147,700.00) 52.056.850.00 $2.382.190.00 Check My Work Assignment Score: 49.13% TEZOVUZLUUMUUUU $423,690.00 case Labilities and Stockholders' Equity 12 Accounts payable (merchandise creditors) 13 Accrued expenses payable (operating...
 Statement of Cash Flows-Indirect Method The comparative balance sheet of Livers Inc. for December 31, 2013 and 20Y2, is shown as follows: Dec. 31, 20Y3 Dec. 31, 2012 Assets Cash Accounts receivable (net) $251,660 91,170 257,350 $235,180 84,470 250,070 96,890 Inventories Investments 0 Land 221,100 Equipment Accumulated depreciation equipment 132,000 283,950 (66,480) $949,650 (59,620) $828,090 Total assets Liabilities and Stockholders' Equity Accounts payable (merchandise creditors) Accrued expenses payable (operating expenses) $171,890 17,090 9,500 $163,130 21,530 7,450 40,580 Dividends payable Common...
Most questions answered within 3 hours.
-
A cohort study is conducted to determine whether smoking is
associated with an increased risk of...
asked 2 minutes ago -
A statistics student finds herself struggling with a newspaper
article stating that only eighteen percent of...
asked 3 minutes ago -
Create the pseudo-code/flowchart for an application class named
Monogram. Its main() method inputs three variables that...
asked 2 minutes ago -
How many liters of water are required to dissolve 1.00 g of
silver chromate? Express your...
asked 5 minutes ago -
Hot: T_inlet = 80, T_out = 65
Cold: T_inlet = 10, T_out = 25
Explain in...
asked 6 minutes ago -
Two protons fly in different directions and collide. They both
have a total energy of 1.5...
asked 15 minutes ago -
What is the oxidation number of each atom in sodium phosphate,
Na3PO4?
>>> SHOW YOUR WORK...
asked 21 minutes ago -
D company purchased goods with a list price of $60000, subject
to trade discounts of 20%...
asked 23 minutes ago -
Transposable elements make up more than 40% of the human genome
and are inserted more-or-less randomly...
asked 34 minutes ago -
Can I get some samples of the following:
1) Write four sentences in first person, singular....
asked 39 minutes ago -
Described how search engines work. Be sure to describe in detail
.
asked 40 minutes ago -
The position of a particle as a function of time is given by
x=(2.0m/s)t+(−3.0m/s3)t^3. Part A...
asked 45 minutes ago