
Homework Answers

Add Answer to:
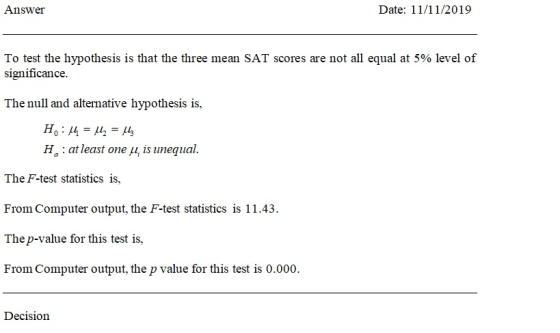
question boy Using the following output: Analysis of Variance for SAT Group 2 625.2 1... 0.000...
The College Board provided comparisons of Scholastic Aptitude Test (SAT) scores based on the highest level...
 The College Board provided comparisons of Scholastic Aptitude Test (SAT) scores based on the highest level of education attained by the test taker's parents. A research hypothesis was that students whose parents had attained a higher level of education would on average score higher on the SAT. The overall mean SAT math score was 514.SAT math scores for independent samples of students follow. The first sample shows the SAT math test scores for students whose parents are college graduates with...
Coaching companies claim that their courses can raise the SAT scores of high school students. Of...
Coaching companies claim that their courses can raise the SAT scores of high school students. Of course, students who retake the SAT without paying for coaching generally raise their scores. A random sample of students who took the SAT twice found 427 who were coached and 2733 who were uncoached. Starting with their verbal scores on the first and second tries, we have these summary statistics: Try 1 Try 2 Gain x s x s x s...
The College Board provided comparisons of Scholastic Aptitude Test (SAT) scores based on the highest level...
The College Board provided comparisons of Scholastic Aptitude Test (SAT) scores based on the highest level of education attained by the test taker's parents. A research hypothesis was that students whose parents had attained a higher level of education would on average score higher on the SAT. The overall mean SAT math score was 514. SAT math scores for independent samples of students follow. The first sample shows the SAT math test scores for students whose parents are college graduates...
Suppose that the population of SAT scores is normally distributed with a mean of 1000 and...
Suppose that the population of SAT scores is normally distributed with a mean of 1000 and a standard deviation of 100. To determine the effect of a course to prepare for the SAT, a random sample of 25 students who have taken the course is selected. The sample mean SAT is 1050. Do these data provide sufficient evidence at the 1% significance level to infer that students who take the course perform better on the SAT on average? Assume that...
Coaching companies claim that their courses can raise the SAT scores of high scho...continues
Coaching companies claim that their courses can raise the SAT scores of high school students. Of course, students who retake the SAT without paying for coachinggenerally raise their scores. A random sample of students who took the SAT twice found 427 who were coached and 2733 who were uncoached. Starting with their verbalscores on the first and second tries, we have these summary statistics:Try 1 Try 2 Gainx s x s x sCoached 500 92 529 97 29 59Uncoached 506...
The first two questions refer to the following information: Researchers developed an online tool to help...
The first two questions refer to the following information: Researchers developed an online tool to help ESL students learn prepositions and metaphors. A study measuring academic success in ESL students randomly sampled 100 Spanish speaking ESL students using traditional ESL classes and the new language tool and 81 Portuguese speaking ESL students using traditional ESL classes and the new language tool, and scored them on a common English fluency scale (higher score representing greater degree of fluency). The researchers suspected...
A researcher wants to determine whether high school students who attend an SAT preparation course score...
A researcher wants to determine whether high school students who attend an SAT preparation course score significantly different on the SAT than students who do not attend the preparation course. For those who do not attend the course, the population mean is 1050 (? = 1050). The 16 students who attend the preparation course average 1150 on the SAT, with a sample standard deviation of 300. On the basis of these data, can the researcher conclude that the preparation course...
A researcher wants to determine whether high school students who attend an SAT preparation course score...
A researcher wants to determine whether high school students who attend an SAT preparation course score significantly different on the SAT than students who do not attend the preparation course. For those who do not attend the course, the population mean is 1050 (? = 1050). The 16 students who attend the preparation course average 1200on the SAT, with a sample standard deviation of 100. On the basis of these data, can the researcher conclude that the preparation course has...
Return to the SAT data in Exercise 2. Perform a two-sample t-test to determine whether there is s...
 Exercise 2:
Return to the SAT data in Exercise 2. Perform a two-sample t-test to determine whether there is sufficient evidence to claim a difference in the mean verbal SAT scores for high school students who intend to major in engineering and language/literature. Again, report the: p-value You should find the p-value using R. How does this result compare to the result in Exercise 2? Note that it is a mathematical/statistical fact that: If X ~ tor then Y =...
Exercise 2:
Return to the SAT data in Exercise 2. Perform a two-sample t-test to determine whether there is sufficient evidence to claim a difference in the mean verbal SAT scores for high school students who intend to major in engineering and language/literature. Again, report the: p-value You should find the p-value using R. How does this result compare to the result in Exercise 2? Note that it is a mathematical/statistical fact that: If X ~ tor then Y =...
Question 7 - of 17 Step 2 of 5 01:38:52 An SAT prep course claims to...
 Question 7 - of 17 Step 2 of 5 01:38:52 An SAT prep course claims to improve the test score of students. The table below shows the scores for seven students the first two times they took the verbal SAT. Before taking the SAT for the second time, each student took a course to try to improve his or her verbal SAT scores. Do these results support the claim that the SAT prep course improves the students' verbal SAT scores?...
 The College Board provided comparisons of Scholastic Aptitude Test (SAT) scores based on the highest level of education attained by the test taker's parents. A research hypothesis was that students whose parents had attained a higher level of education would on average score higher on the SAT. The overall mean SAT math score was 514.SAT math scores for independent samples of students follow. The first sample shows the SAT math test scores for students whose parents are college graduates with...
 Exercise 2:
Return to the SAT data in Exercise 2. Perform a two-sample t-test to determine whether there is sufficient evidence to claim a difference in the mean verbal SAT scores for high school students who intend to major in engineering and language/literature. Again, report the: p-value You should find the p-value using R. How does this result compare to the result in Exercise 2? Note that it is a mathematical/statistical fact that: If X ~ tor then Y =...
Exercise 2:
Return to the SAT data in Exercise 2. Perform a two-sample t-test to determine whether there is sufficient evidence to claim a difference in the mean verbal SAT scores for high school students who intend to major in engineering and language/literature. Again, report the: p-value You should find the p-value using R. How does this result compare to the result in Exercise 2? Note that it is a mathematical/statistical fact that: If X ~ tor then Y =...
 Question 7 - of 17 Step 2 of 5 01:38:52 An SAT prep course claims to improve the test score of students. The table below shows the scores for seven students the first two times they took the verbal SAT. Before taking the SAT for the second time, each student took a course to try to improve his or her verbal SAT scores. Do these results support the claim that the SAT prep course improves the students' verbal SAT scores?...
Most questions answered within 3 hours.
-
Phosphorous + bromine = phosphorous tribromide. If 35.0 g of
bromine are reacted and 27.9 grams...
asked 1 hour ago -
Derive the long wavelength limit of the Planck energy density
distribution
asked 56 minutes ago -
Calculate the pH of each of the following solutions.
0.50 M HBr
3.1×10⁻⁴ M KOH
4.2×10⁻⁵...
asked 4 hours ago -
For the year ended December 31, Depot Max’s cost of merchandise
sold was $85,600. Inventory at the...
asked 4 hours ago -
Week 10 - Professional Memo Assignment
Professional Memo Assignment
Your mission for this week, should you...
asked 4 hours ago -
Write a Python program that stores the data for each
player on the team, and it...
asked 4 hours ago -
In
the last 3 months, mike never knows when he is going to get his
allowance...
asked 5 hours ago -
Is Ca(OH)2 a Bronsted base, Lewis base, or both? Why?
asked 5 hours ago -
1A- Why don’t voters complain about U.S. tariffs on imported
sugar?
Because sugar is only a...
asked 5 hours ago -
Cash Payback Period
Primera Banco is evaluating two capital investment proposals for
a drive-up ATM kiosk,...
asked 5 hours ago -
Create a button in Swift (Xcode) that will create a charge,
create a charge using Stripe's...
asked 5 hours ago -
The reaction rate of CO and NO2 in the reaction
CO(g) + NO2(g) → CO2(g) +...
asked 5 hours ago