Suppose the following data show the percentage of 17- to 24-year-olds who are attending college in...
Suppose the following data show the percentage of 17- to 24-year-olds who are attending college in several metropolitan statistical areas in four geographic regions of the United States.
| Northeast | Midwest | South | West |
|---|---|---|---|
| 28.6 | 37.5 | 60.2 | 16.3 |
| 40.0 | 33.1 | 37.9 | 33.7 |
| 32.3 | 23.0 | 28.4 | 22.1 |
| 47.0 | 43.5 | 41.9 | 13.2 |
| 33.1 | 32.3 | 34.0 | 43.4 |
| 15.2 | 57.6 | 18.3 | 26.1 |
| 37.2 | 31.1 | 30.3 | 57.0 |
| 36.6 | 64.6 | 67.6 | 14.3 |
| 38.2 | 26.9 | 31.9 | 36.8 |
| 58.1 | 54.7 | 29.6 | 28.9 |
| 61.3 | 78.3 | 38.4 | 17.4 |
| 42.2 | 29.8 | 31.5 | |
| 75.2 | 30.4 | 52.2 | |
| 36.8 | 23.3 | 52.0 | |
| 28.4 | 34.8 | 25.0 | |
| 60.1 | 24.6 | 29.8 | |
| 57.7 | 54.9 | 28.4 | |
| 20.3 | 31.7 | 31.9 | |
| 29.2 | 42.6 | 22.1 | |
| 25.1 | 70.4 | 34.0 | |
| 74.6 | 22.5 | 33.8 | |
| 36.9 | 29.9 | 37.6 | |
| 28.2 | 31.4 | 33.0 | |
| 27.3 | 21.7 | 28.7 | |
| 31.3 | 31.7 | 21.8 | |
| 57.0 | 39.0 | ||
| 27.7 | 39.8 | ||
| 32.7 | 34.7 | ||
| 39.8 | 21.4 | ||
| 39.7 | 34.9 | ||
| 26.6 | |||
| 33.3 |
Use α = 0.05 to test whether the mean percentage of 17- to 24-year-olds who are attending college is the same for the four geographic regions.
State the null and alternative hypotheses.
H0: μN =
μM = μS =
μW
Ha: μN ≠
μM ≠ μS ≠
μWH0: Not all the
population means are equal.
Ha: μN =
μM = μS =
μW
H0: At least two of the population means are
equal.
Ha: At least two of the population means are
different. H0: μN ≠
μM ≠ μS ≠
μW
Ha: μN =
μM = μS =
μWH0:
μN = μM =
μS = μW
Ha: Not all the population means are equal.
Find the value of the test statistic. (Round your answer to two decimal places.)
Find the p-value. (Round your answer to three decimal places.)
p-value =
State your conclusion.
Reject H0. There is not sufficient evidence to conclude that the percentage of 17- to 24-year-olds who are attending college is not the same for the four geographic regions.
Reject H0. There is sufficient evidence to conclude that the percentage of 17- to 24-year-olds who are attending college is not the same for the four geographic regions.
Do not reject H0. There is not sufficient evidence to conclude that the percentage of 17- to 24-year-olds who are attending college is not the same for the four geographic regions.
Do not reject H0. There is sufficient evidence to conclude that the percentage of 17- to 24-year-olds who are attending college is not the same for the four geographic regions.
Homework Answers
The statistical software output for this problem is:
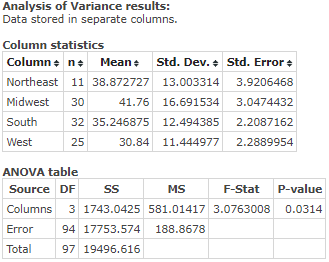
Hence,
Hypotheses:
H0: μN =
μM = μS =
μW
Ha: Not all the population means are equal.
Test statistic = 3.08
P - value = 0.031
Conclusion: Option B is correct.
Add Answer to:
Suppose the following data show the percentage of 17- to
24-year-olds who are attending college in...
Suppose the following data show the percentage of 17- to 24-year-olds who are attending college in...
Suppose the following data show the percentage of 17- to 24-year-olds who are attending college in several metropolitan statistical areas in four geographic regions of the United States. Northeast Midwest South West 28.6 36.2 60.5 16.2 39.1 32.7 37.1 33.2 31.1 22.9 28.0 21.5 46.0 44.1 40.5 12.1 33.0 31.5 34.4 43.8 14.7 59.1 18.3 27.0 37.1 31.3 30.9 57.1 36.9 64.6 67.8 14.5 37.5 26.8 33.3 36.8 58.6 55.6 30.2 28.4 60.7 78.0 38.4 16.8 42.5 29.9 32.8 74.6...
Suppose the following data show the percentage of 17- to 24-year-olds who are attending college in several metropolitan...
Suppose the following data show the percentage of 17- to 24-year-olds who are attending college in several metropolitan statistical areas in four geographic regions of the United States. Northeast Midwest South West 29.2 36.8 59.4 16.5 40.5 33.9 37.9 32.9 32.1 22.8 27.7 23.0 46.2 43.2 40.9 12.8 32.9 32.8 34.7 44.2 15.4 59.1 18.9 26.2 36.4 30.9 29.8 56.9 36.3 63.8 68.0 13.8 36.9 26.8 32.0 37.7 58.2 56.3 30.5 28.0 60.6 79.1 39.8 17.6 43.0 29.4 33.1 73.9...
17% of all college students volunteer their time. Is the percentage of college students who are...
 17% of all college students volunteer their time. Is the percentage of college students who are volunteers larger for students receiving financial aid? Of the 307 randomly selected students who receive financial aid, 68 of them volunteered their time. What can be concluded at the a = 0.01 level of significance? a. For this study, we should use Select an answer b. The null and alternative hypotheses would be: Ho: ? ? (please enter a decimal) Hj: ? ? Please...
18% of all college students volunteer their time. Is the percentage of college students who are...
18% of all college students volunteer their time. Is the percentage of college students who are volunteers larger for students receiving financial aid? Of the 301 randomly selected students who receive financial aid, 72 of them volunteered their time. What can be concluded at the αα = 0.10 level of significance? For this study, we should use Select an answer t-test for a population mean z-test for a population proportion The null and alternative hypotheses would be: H0:H0: ? p...
Suppose course evaluation ratings for four college instructors are shown in the following table. Instructor Black...
Suppose course evaluation ratings for four college instructors are shown in the following table. Instructor Black Jennings Swanson Wilson 89 86 89 80 80 79 77 83 78 81 69 57 69 83 81 72 97 98 83 88 68 98 81 86 83 84 94 85 82 Use α = 0.05 and test for a significant difference among the rating for these instructors. State the null and alternative hypotheses. H0: Not all populations of teaching evaluations are identical. Ha:...
Suppose course evaluation ratings for four college instructors are shown in the following table. Instructor Black...
Suppose course evaluation ratings for four college instructors are shown in the following table. Instructor Black Jennings Swanson Wilson 88 87 88 80 80 78 79 83 76 81 68 59 68 83 81 72 99 96 83 86 66 96 81 87 83 84 94 85 82 Use α = 0.05 and test for a significant difference among the rating for these instructors. State the null and alternative hypotheses. H0: MedianB ≠ MedianJ ≠ MedianS ≠ MedianW Ha: MedianB...
Suppose course evaluation ratings for four college instructors are shown in the following table. Instructor Black J...
Suppose course evaluation ratings for four college instructors are shown in the following table. Instructor Black Jennings Swanson Wilson 89 86 89 80 80 79 77 84 78 81 69 57 69 84 81 72 97 98 84 88 68 98 81 86 84 83 93 85 82 Use α = 0.05 and test for a significant difference among the rating for these instructors. State the null and alternative hypotheses. H0: MedianB = MedianJ = MedianS = MedianW Ha: MedianB...
The National Football League (NFL) holds its annual draft of the nation's best college football players...
The National Football League (NFL) holds its annual draft of the nation's best college football players in April each year. Prior to the draft, various sporting news services project the players who will be drafted along with the order in which each will be selected in what are called mock drafts. Players who are considered to have superior potential as professional football players are selected earlier in the draft. Suppose the following table shows projections by one mock draft service...
The National Football League (NFL) holds its annual draft of the nation's best college football players...
 The National Football League (NFL) holds its annual draft of the nation's best college football players in April each year. Prior to the draft, various sporting news services project the players who will be drafted along with the order in which each will be selected in what are called mock drafts. Players who are considered to have superior potential as professional football players are selected earlier in the draft. Suppose the following table shows projections by one mock draft service...
 17% of all college students volunteer their time. Is the percentage of college students who are volunteers larger for students receiving financial aid? Of the 307 randomly selected students who receive financial aid, 68 of them volunteered their time. What can be concluded at the a = 0.01 level of significance? a. For this study, we should use Select an answer b. The null and alternative hypotheses would be: Ho: ? ? (please enter a decimal) Hj: ? ? Please...
 The National Football League (NFL) holds its annual draft of the nation's best college football players in April each year. Prior to the draft, various sporting news services project the players who will be drafted along with the order in which each will be selected in what are called mock drafts. Players who are considered to have superior potential as professional football players are selected earlier in the draft. Suppose the following table shows projections by one mock draft service...
Most questions answered within 3 hours.
-
Let M = 8.00kg, m = 6.00kg, θ = 40.00, and the coefficient of
kinetic friction...
asked 5 minutes ago -
Java. For C through H True or false?
c. Primitive variables must be objects.
d. Integer...
asked 10 minutes ago -
Write a program that turns a 32-bit numeric value (e.g.,
0xFFFFh) and converts it to a...
asked 12 minutes ago -
A motor produces a torque of 0.25 N m at an angular velocity of
7200 revolutions...
asked 25 minutes ago -
***Please answer the below java question***
Are static methods inheritable? Can they be overridden?
asked 27 minutes ago -
In reaching her destination, a backpacker walks with an average
velocity of 1.13 m/s, due west....
asked 28 minutes ago -
Write two C programs that run a
server program and a client program concurrently.
Server program:...
asked 27 minutes ago -
Executive Program Practical Connection Assignment
Subject : Operations Security.
Assignment:
Provide a reflection of at least...
asked 37 minutes ago -
Every time Casey is at bat he has a 0.4 probability of
getting on base (assume...
asked 45 minutes ago -
The Walston Company is to be liquidated and has the following
liabilities:
Income taxes
$
9,400...
asked 52 minutes ago -
If
the more comprehensive data is available in MEPS, why does the NHIS
still exist? How...
asked 1 hour ago -
Koo argues that the Japanese economy in the 1990s suffered from
a balance sheet recession. What...
asked 1 hour ago